How the Trading Simulation Works
A deep dive into ChartingPark's simulation engine. Learn the differences between Rated and Backtesting modes, how position management works, and how to review sessions with replay.
ChartingPark's simulation engine powers its trading simulation. It takes real historical chart data and plays it forward, letting you practice trading as if the market were live. Whether you're here to learn trading fundamentals or refine an existing approach, understanding these modes will help you get the most out of every session.
If you haven't used the platform yet, start with our first practice session guide and then come back here once you want the deeper mechanics.
The Core Concept
Every session drops you onto a real historical chart — a stock, forex pair, index, ETF, or commodity from some point in the past. The chart plays forward candle by candle, and you make trading decisions exactly as you would in a live market. The difference is speed: you can fast-forward through hours or days of price action in seconds.
There are two distinct modes for running simulations: Rated and Backtesting. They share the same charting engine, but the rules and tools available are different.
Rated Mode
Rated mode is competitive practice. Every trade you make here affects your skill rating, so it matters. The constraints are intentional — they mirror real trading conditions and force disciplined decision-making.
Here's how Rated mode works:
- Rating impact — Your performance adjusts your skill rating after each session. Consistent, well-managed trades push your rating up. Reckless or losing trades bring it down.
- Stop loss required — Every trade must have a stop loss. This isn't optional. The system enforces risk management from the start.
- 90-day auto-close — Positions that run for 90 simulated days without hitting a stop loss or take profit are closed automatically. No sitting on a trade forever.
- Challenges active — Your trades in Rated mode count toward challenge objectives (consecutive wins, high R:R trades, streaks, etc.).
- Random asset assignment — You don't choose which asset you trade. The system assigns one randomly from your selected asset classes, so you can't rely on familiarity with a particular instrument.
Rated mode is where you go to prove and measure your skills. Treat it like a real trading session.
Backtesting Mode
Backtesting mode is your sandbox. There's no rating impact, which means you're free to experiment, test ideas, and explore without consequences.

In addition to the freedom from rating pressure, Backtesting mode gives you extra tools that aren't available in Rated:
- Jump to Date — Skip to any specific date on the chart. Useful when you want to practice on a known historical event or setup.
- Screeners — Filter assets by criteria to find specific types of setups to trade.
- Chart overlays — Add additional visual layers to your analysis.
- Time axis toggle — Switch how the time axis is displayed.
- Choose specific assets — Unlike Rated mode, you pick exactly which asset you want to trade — any stock, forex pair, index, ETF, or commodity available on the platform.
- Optional stop loss — You can trade without a stop loss if you want to test a specific scenario, though it's still a good habit to set one.
Use Backtesting when you want to test a new strategy, practice on a specific asset, or study how a particular market period played out. Once you feel confident, take the strategy into Rated mode to see how it performs under pressure.
Position Management
Whether you're in Rated or Backtesting mode, the position management tools are the same. Here's everything you can do with an open trade:
Opening a Position
Choose Long or Short, set your position size, define your stop loss (required in Rated, optional in Backtesting), and optionally set a take profit. Confirm, and your position is live on the chart.
Adding to a Position
If the trade is moving in your favor and you want to increase your exposure, you can add to the position. Your average entry price updates accordingly.
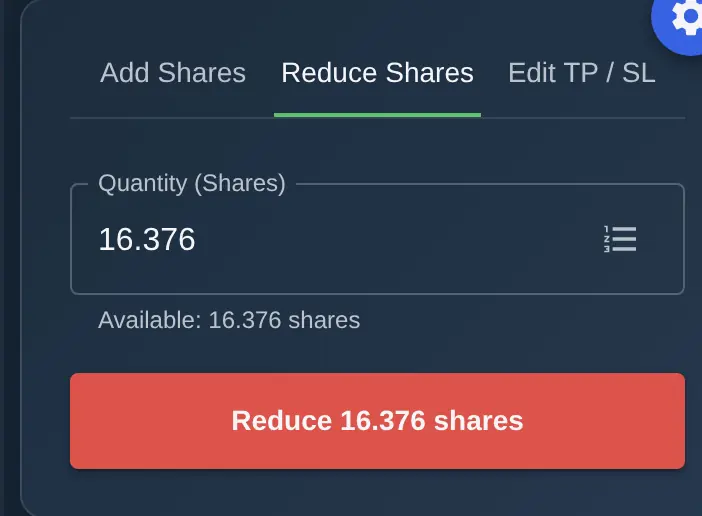
Reducing a Position
Take partial profits by closing a portion of your position while leaving the rest running. This lets you lock in some gains while staying in the trade for further upside.
Editing Stop Loss and Take Profit
Adjust your SL and TP levels at any time while the position is open. Drag the lines on the chart or enter new values in the panel. This is essential for managing trades as new information appears on the chart.
Jump to Outcome
Don't want to wait? Use Jump to Outcome to instantly fast-forward the chart until your stop loss or take profit is hit. The chart skips straight to the resolution of your trade.
Manual Close
Close the entire position at the current market price whenever you decide to. You don't have to wait for SL or TP to be triggered.
Session Replay
Every completed session is saved and can be reviewed later. Session Replay is one of ChartingPark's most valuable features — it's where learning happens after the trading is done.
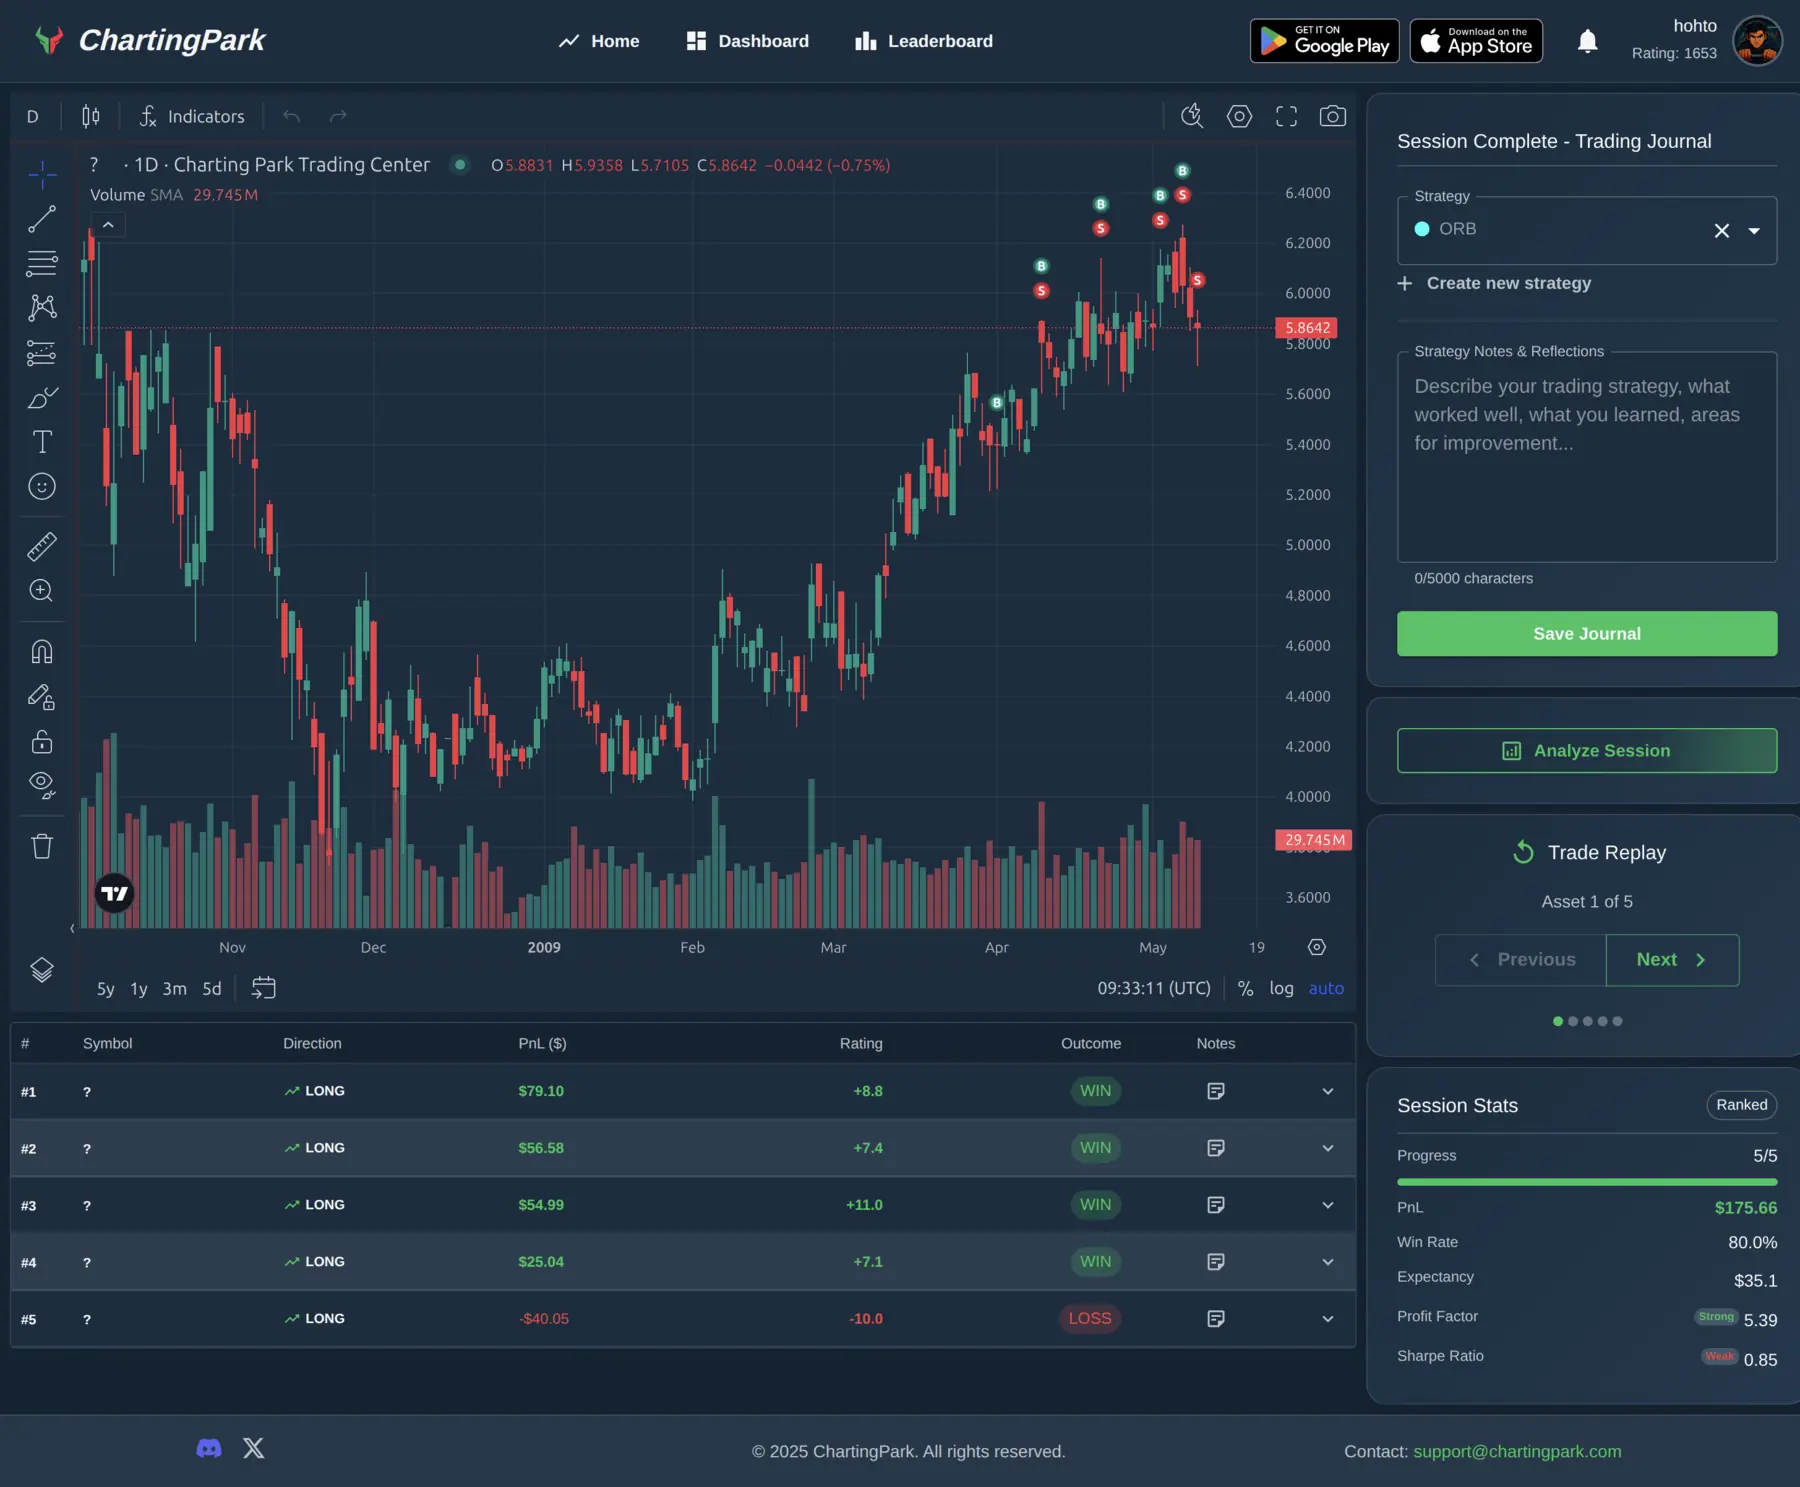
Stepping Through Trades
Open any past session and step through each trade on the chart. You'll see your entry and exit points marked, along with the stop loss and take profit lines you set. Navigate between trades with arrow buttons to move forward and backward through the session.
Position Summary
Each trade is listed in a summary table showing the direction (Long or Short), entry and exit prices, P&L, and the outcome (stopped out, target hit, or manual close). You can see at a glance which trades worked and which didn't.
Journal Notes
Add notes to individual trades or to the session as a whole. This is where you record why you took a trade, what you saw on the chart, what went right, and what you'd do differently next time.
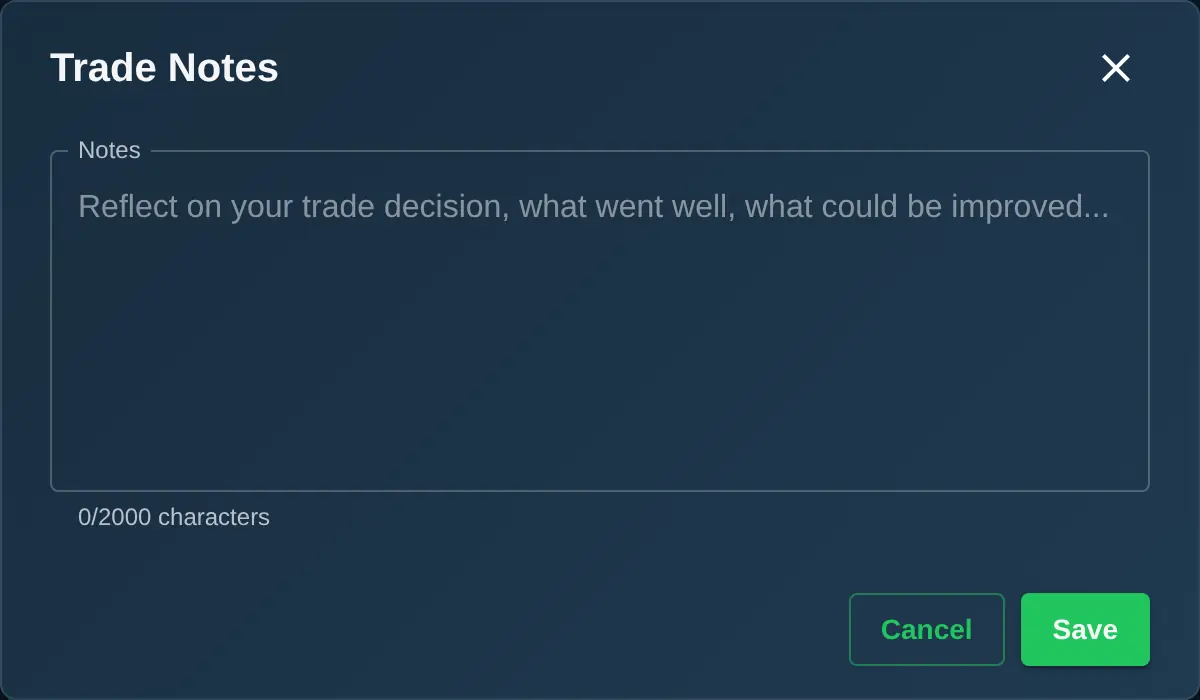
Building a trade journal is one of the most effective ways to accelerate learning. ChartingPark makes it easy by attaching your notes directly to the chart context where the trade happened.
Session Statistics
At the session level, you'll find detailed statistics including:
- Expectancy — The average amount you expect to win or lose per trade.
- Profit factor — Total gains divided by total losses. Above 1.0 means you're net positive.
- Sharpe ratio — A measure of risk-adjusted returns.
- Win rate — Percentage of profitable trades.
- Maximum drawdown — The biggest peak-to-trough decline during the session.
These numbers give you an objective view of your performance beyond just "did I make money?"
Strategies
You can tag sessions with a strategy name. This lets you track how different approaches perform over time. For example, you might tag some sessions as "Breakout" and others as "Mean Reversion," then compare the statistics across your strategy categories to see which approach works best for you.
Between Rated and Backtesting modes, full position management, session replay, and strategy tracking, ChartingPark gives you everything you need to practice trading systematically and learn from every session.