Rating, Leaderboards, and Challenges: Track Your Trading Progress
Understand ChartingPark's skill rating system, compete on leaderboards, and complete challenges that push you to improve. See how the gamification loop keeps you progressing.
One of the hardest things about learning to trade is knowing whether you're actually getting better. P&L alone doesn't tell the full story — a few lucky trades can mask bad habits, and a rough week can hide real improvement. ChartingPark solves this with a skill rating system, leaderboards, and structured challenges that give you clear, objective feedback on your progress.
Skill Rating
Every trader on ChartingPark has a skill rating. It's a single number that reflects your trading consistency, risk management, and profitability over time.
How It Works
- Starting point — Everyone begins at 1,500.
- Where it changes — Your rating adjusts in Rated simulation sessions, the Daily Challenge and Patterns mode. Only Backtesting has no rating impact.
- What it rewards — The system values consistency and discipline over raw profit. A trader who wins 55% of the time with good risk management will out-rate a trader who swings between big wins and big losses.
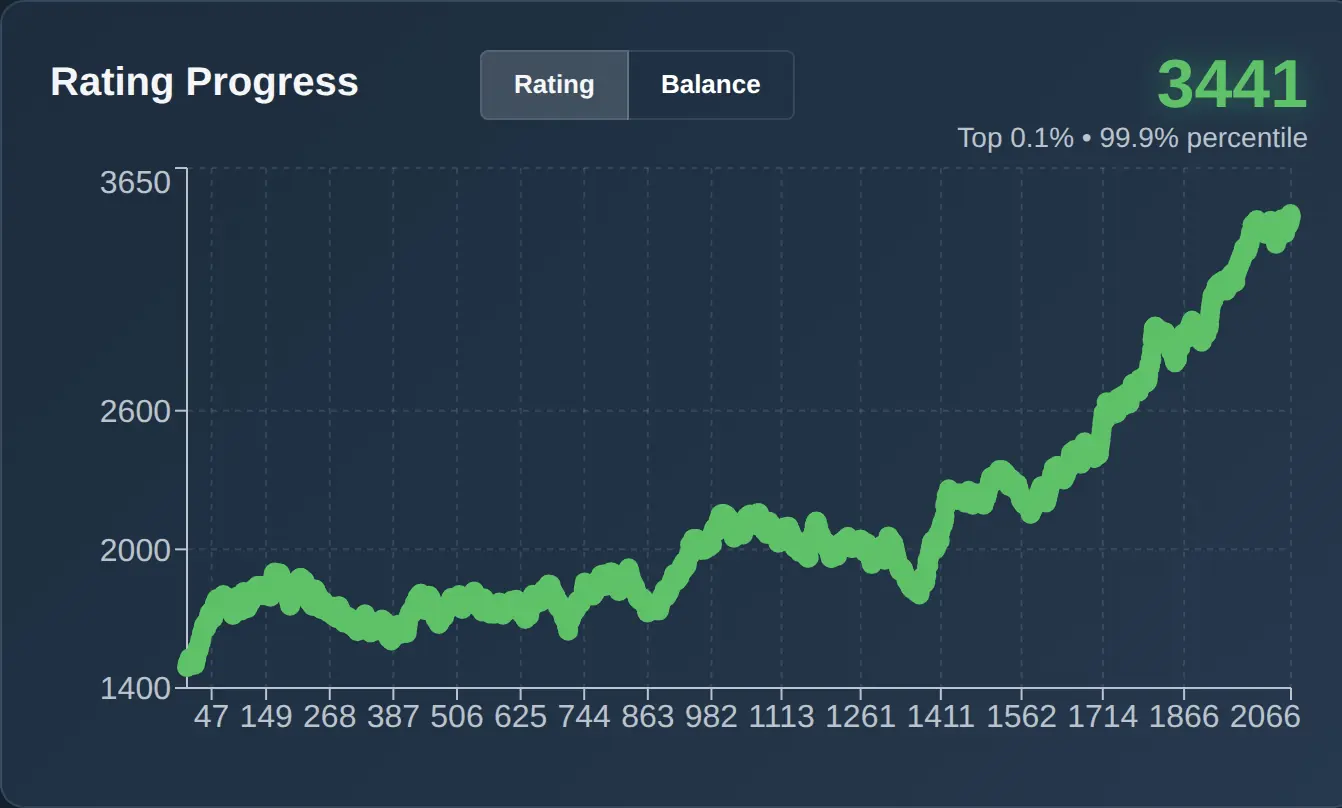
- Visible progression — Your rating history is displayed as a graph on your dashboard, so you can see trends over weeks and months.
The rating is designed to be honest. It won't inflate to make you feel good, and it won't punish you unfairly for a single bad trade. Over time, it converges on your true skill level — and when you improve, the number reflects that.
Leaderboards
ChartingPark has three competitive leaderboards, each ranking traders on a different dimension:
Simulation Leaderboard
Ranked by overall skill rating. This is the main competitive ranking and reflects long-term performance across Rated sessions. The top 3 traders are displayed on a podium.
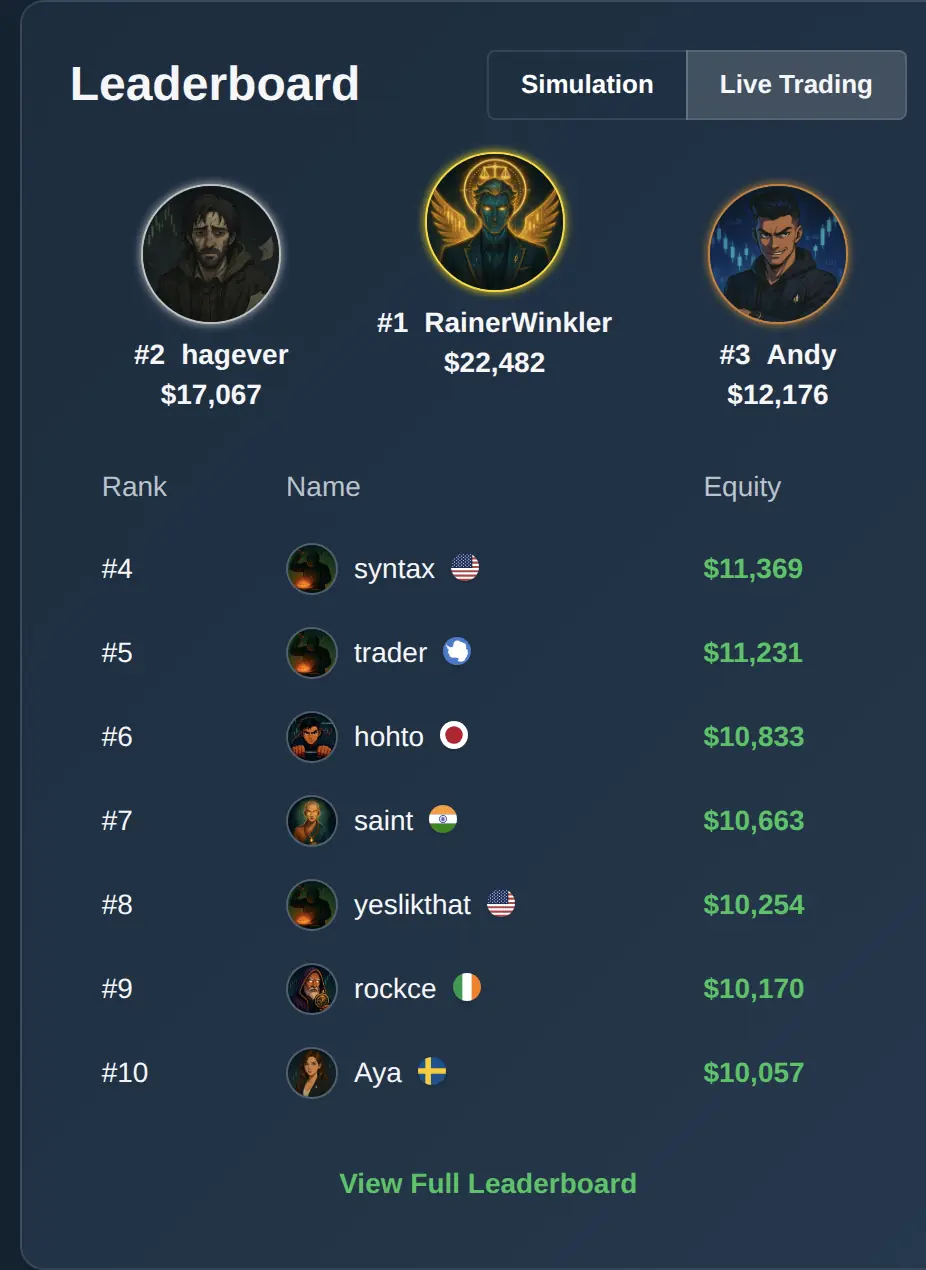
Live Trading Leaderboard
Ranked by demo account equity. This tracks performance in the live trading mode, where you trade on real-time market data.
Daily Challenge Leaderboard
Ranked by rating gained and accuracy on that day's challenge setups. This resets daily, giving everyone a fresh shot at the top each morning.
Leaderboards add a competitive dimension that makes practice more engaging. Seeing other traders' ratings gives you context for your own performance, and climbing the ranks provides tangible motivation to keep improving.
Challenges
Challenges are specific objectives that push you to develop targeted skills. They're not just busywork — each challenge is designed to reinforce a trading behavior that leads to better results.
Challenge Types
There are four categories of challenges:
Execution Challenges — focused on the quality of your trades:
- Win a set number of trades in a row (consecutive wins)
- Complete trades with a high risk-to-reward ratio
- Execute patience trades where you wait for the right setup
Engagement Challenges — focused on building consistent habits:
- Trading streaks: trade 3, 5, or 7 consecutive days
- Regular activity across different modes
Milestone Challenges — focused on long-term progress:
- Reach rating 1,750
- Reach rating 2,000
- Reach rating 2,500
Special Challenges — unique objectives with memorable names:
- First Victory — Win your first trade
- Triple Threat — Win three trades in a row
- Sharpshooter — Complete a high-accuracy session
- Seven-Day Discipline — Trade seven days in a row
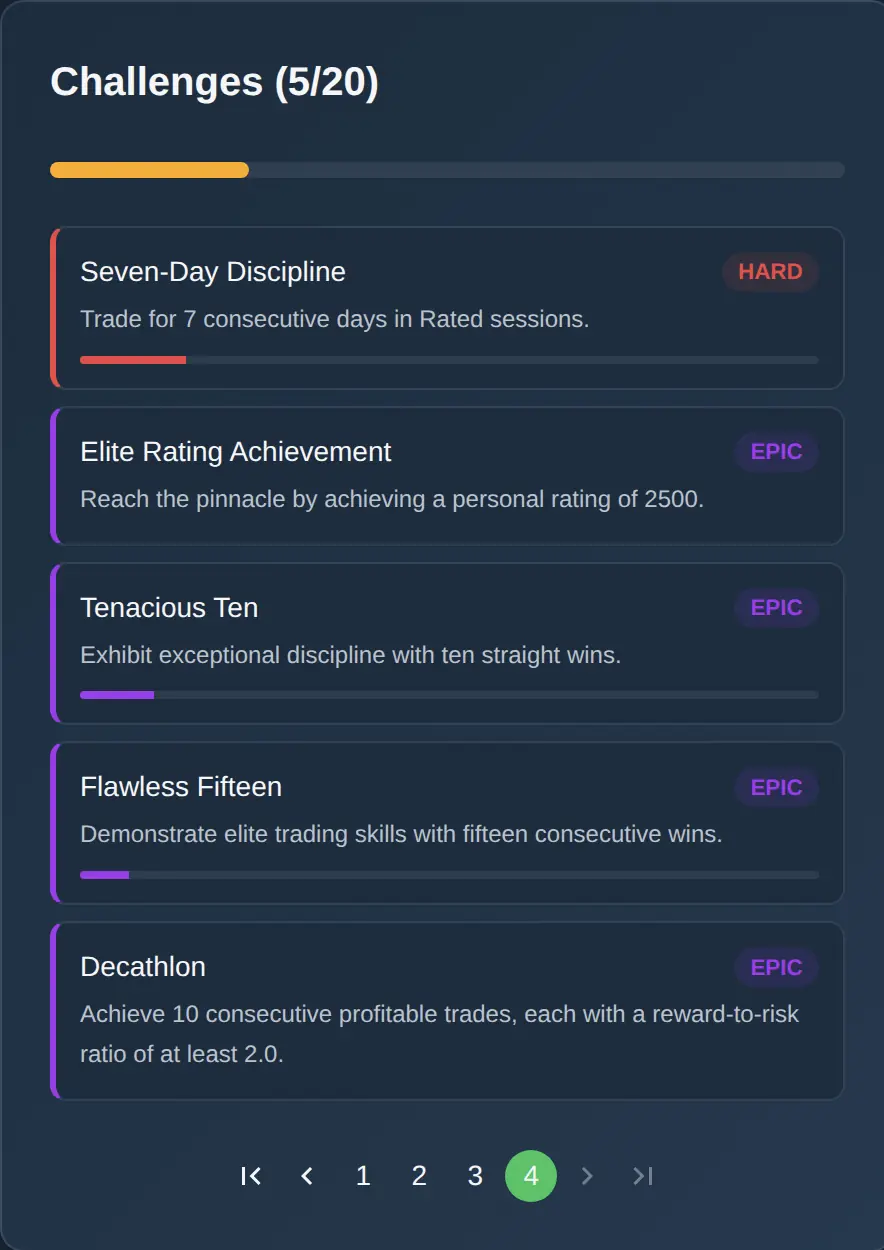
Challenges come in difficulty tiers — Easy, Medium, Hard, and Epic — so there's always something achievable to work toward and something ambitious to aim for.
Streaks
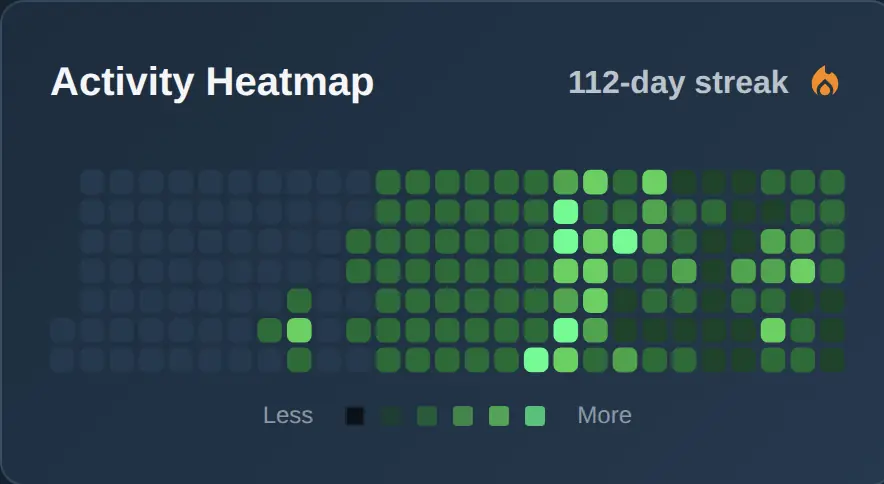
ChartingPark tracks your trading streaks — the number of consecutive days you've been active. Your current streak and your all-time best streak are displayed on your dashboard.
Streaks tie into the engagement challenges. Maintaining a 3-day streak is easy; hitting 7 days takes commitment. But consistency is one of the most important habits in trading, and streaks make it visible and rewarding.
Dashboard Analytics
Your dashboard is where everything comes together. It's the hub for tracking your improvement over time, with several key components:
Key Metrics
A panel showing your most important performance numbers at a glance:
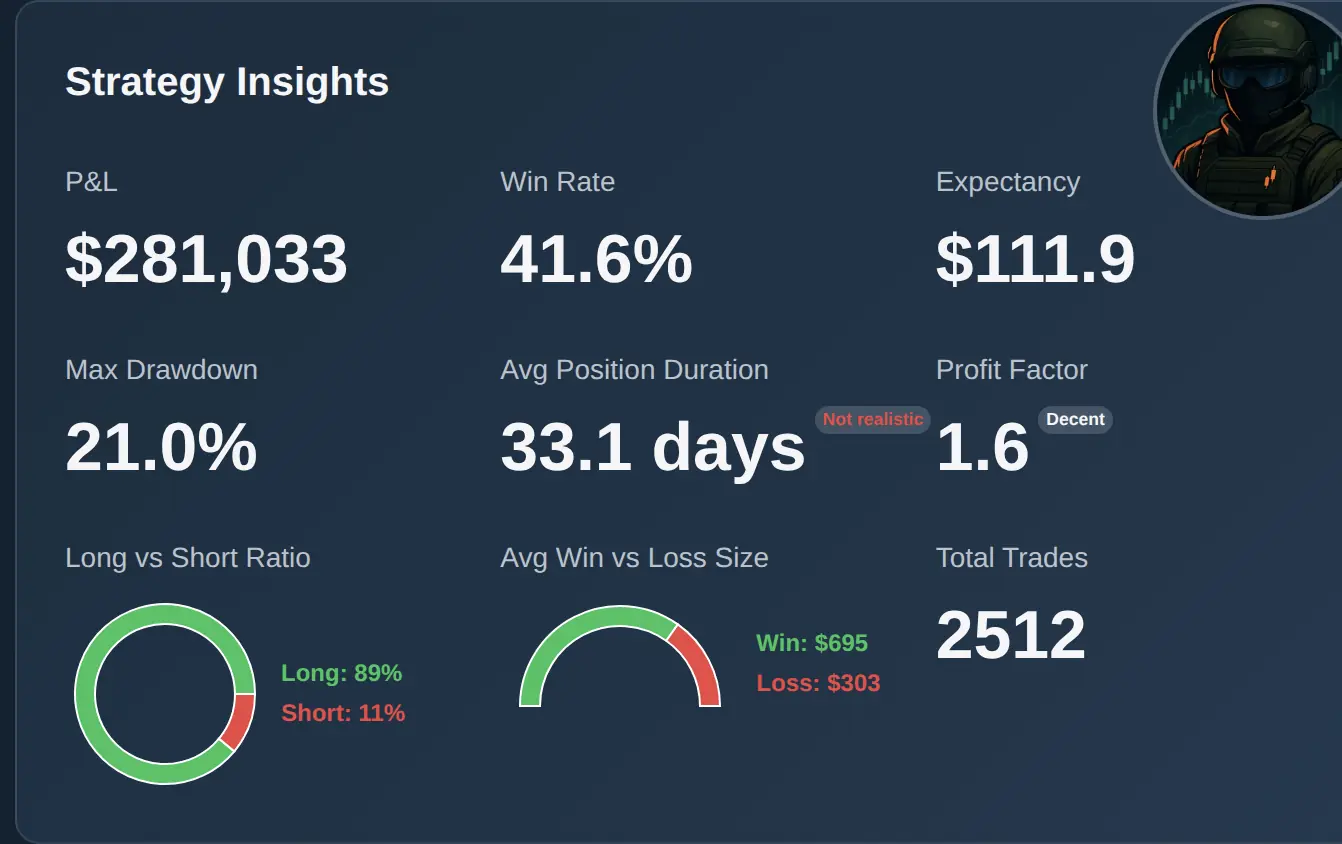
- Win rate — Percentage of trades that ended profitably.
- Expectancy — Average expected gain or loss per trade. Positive means you're profitable on average.
- Profit factor — Total profits divided by total losses. Above 1.0 is profitable.
- Max drawdown — The largest decline from a peak in your account balance. Lower is better — it shows you're managing risk.
Rating Progression Graph
A line chart showing your rating over time. This is the clearest visual indicator of whether you're improving. Look for upward trends rather than focusing on individual spikes or dips.
Session History
A list of all your past sessions with filtering options. You can sort by date, mode, asset type, and result. Click any session to open it in Session Replay for detailed review.
Activity Calendar
A calendar view highlighting the days you traded. It gives you a visual sense of your consistency and helps you identify patterns — like whether you perform differently on weekdays versus weekends, or whether breaks affect your performance.
The Feedback Loop
These systems — rating, leaderboards, challenges, and analytics — aren't separate features. They form a feedback loop:
- Trade in Rated sessions and Daily Challenges.
- Track your rating, review your metrics, and check your challenge progress.
- Identify what's working and what isn't using session replay and analytics.
- Improve by focusing your practice on weak areas using Patterns mode and Backtesting.
- Compete on leaderboards and push for higher challenge tiers.
To see where session replay, Backtesting, and Rated mode fit into that loop, our historical chart simulation guide covers the workflow in detail.
Each round through this loop makes you a more skilled, more consistent trader. The gamification isn't just for fun — it's structured to keep you engaged through the repetition that real skill-building requires.
Whether you're checking your rating after a session, grinding toward a milestone challenge, or watching your name climb the leaderboard, every part of ChartingPark is designed to answer the question: am I getting better?