Your First Trading Session on ChartingPark
A step-by-step walkthrough from opening ChartingPark to completing your first trade. Learn how to start a session, read the chart, open a position, and review your results.
Ready to learn trading by doing? This guide walks you through your first practice trading session on ChartingPark's trading simulator — from opening the app to reviewing your results. The whole process takes about five minutes, and you don't need to create an account to get started.
Step 1: Open ChartingPark and Start a Session
When you open ChartingPark, you can jump straight into a session as a guest. No email, no signup form — just click and go. Your progress won't be saved until you register, but it's the fastest way to see what the platform is about.
To start a Rated session, click the play button. You'll see a dialog where you choose:
- Asset classes — Choose from four categories: Stocks, Forex, Indices & ETFs, and Commodities. Select one, several, or all. The system will pick a random asset for you.
- Session length — 5 trades, 10 trades, 20 trades, or unlimited. Start with 5 if this is your first time.
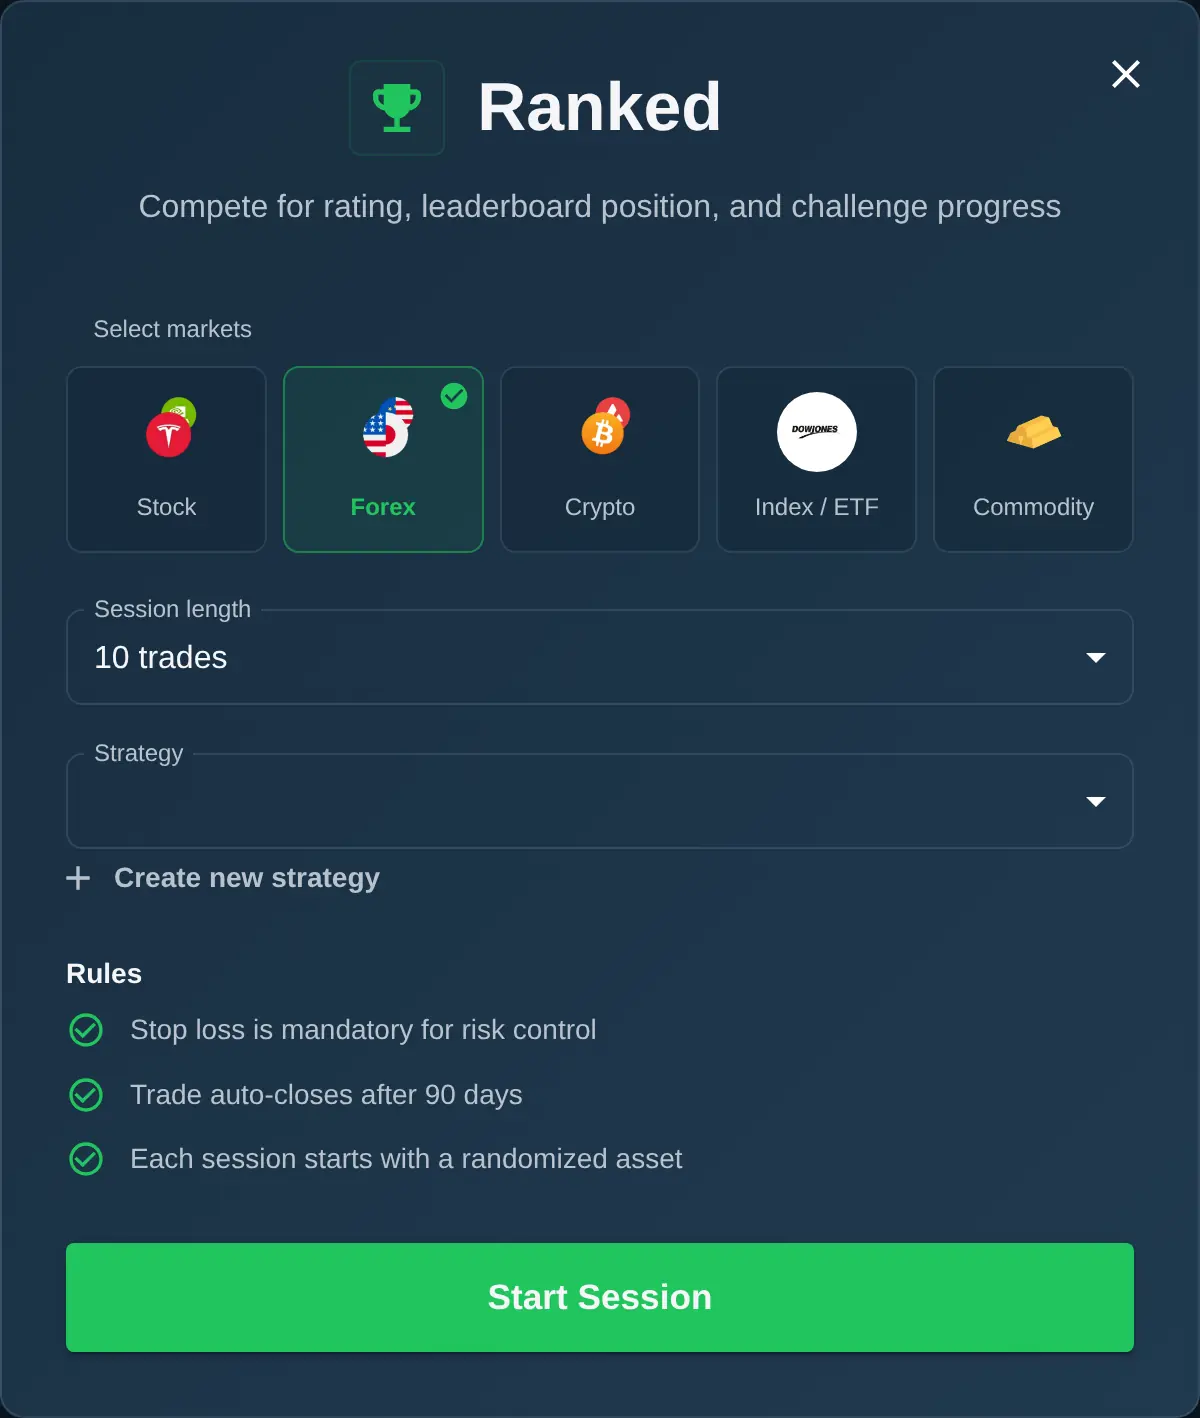
Hit start, and you'll be placed on a historical chart. The asset and time period are hidden — you won't know if you're looking at Tesla from 2021, EUR/USD from 2024, or Gold from 2023. This forces you to focus on chart reading rather than relying on what you already know about a particular asset.
If you want the full explanation of how Rated and Backtesting sessions work behind the scenes, read our guide to historical chart simulation.
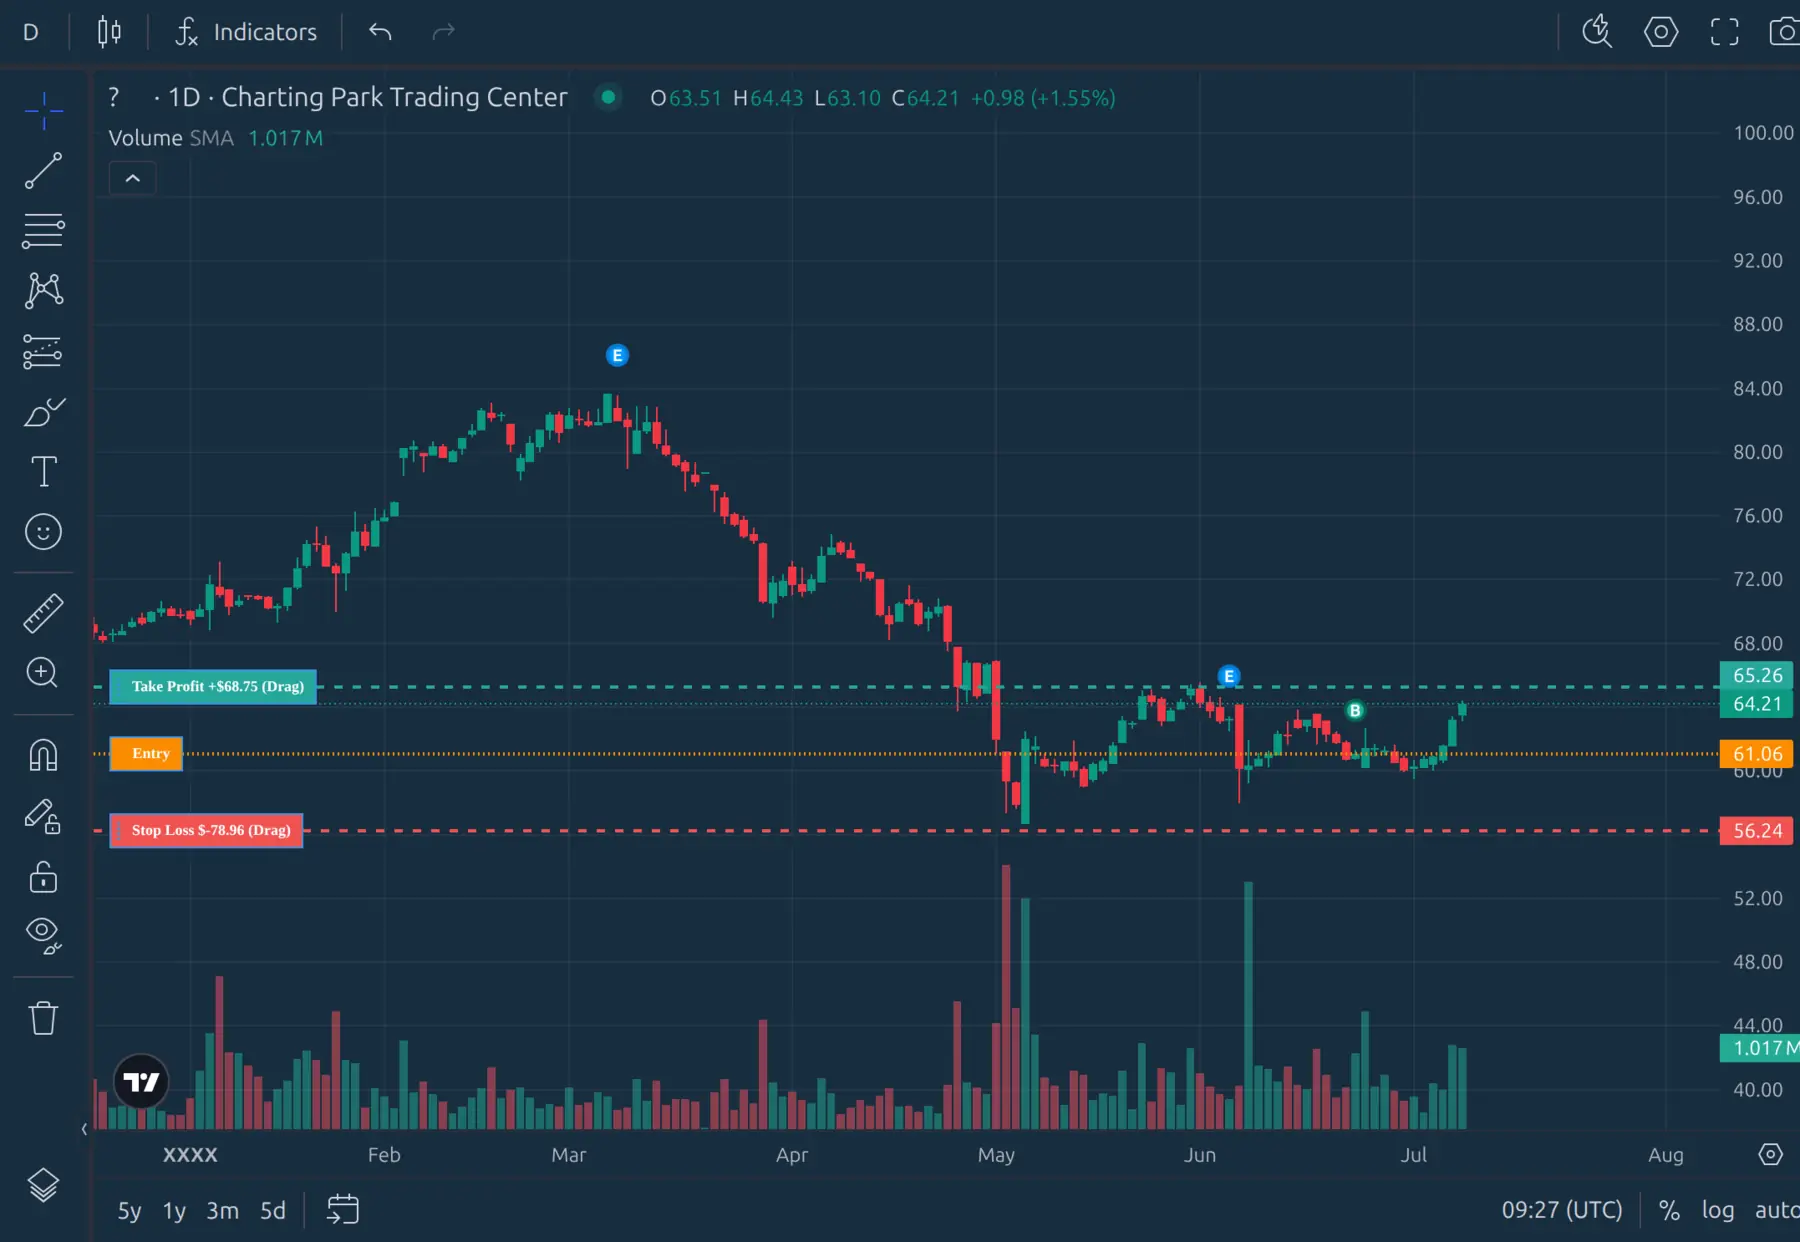
Step 2: Read the Chart
The chart is powered by TradingView — the same charting tool used by millions of traders worldwide. If you've ever used TradingView, you'll feel right at home.
A few things you can do right away:
- Switch timeframes — Toggle between 1-minute, 5-minute, 15-minute, 1-hour, 4-hour, and daily candles using the timeframe buttons at the top.
- Add indicators — Click the indicators button to add moving averages, RSI, MACD, Bollinger Bands, or any other TradingView indicator.
- Zoom and scroll — Scroll to zoom in and out, drag to pan across the chart history.
Take a moment to look at the chart. Is the price trending up or down? Is it at a support level? Are there any patterns forming? This is where your trading decision starts.
Step 3: Place Your First Trade
When you're ready to trade, open the trading panel. Here's what you'll set:
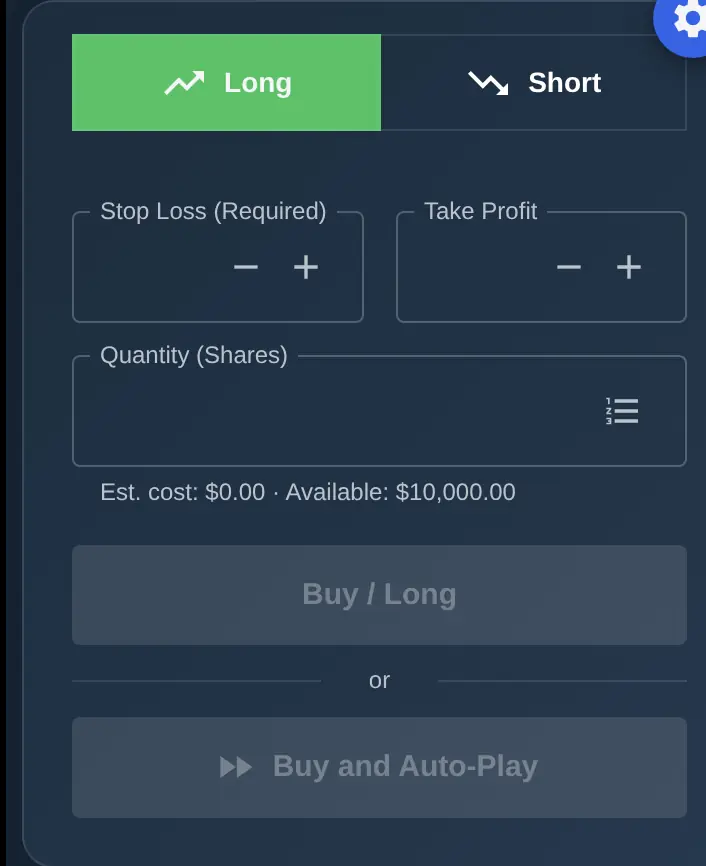
- Direction — Long (you think the price will go up) or Short (you think the price will go down).
- Position size — How much of your virtual balance to put into this trade. Start small while you're learning.
- Stop loss — The price at which your trade automatically closes to limit your loss. In Rated mode, a stop loss is required on every trade.
- Take profit — The price at which your trade automatically closes to lock in profit. This is optional but recommended.
You can set your stop loss and take profit by typing exact values, or by dragging the lines directly on the chart. Once everything looks right, confirm the trade.
Step 4: Watch the Market Move
Once your position is open, the chart continues playing forward. You'll see your entry line, stop loss line, and take profit line on the chart, along with a floating profit/loss indicator that updates in real time.
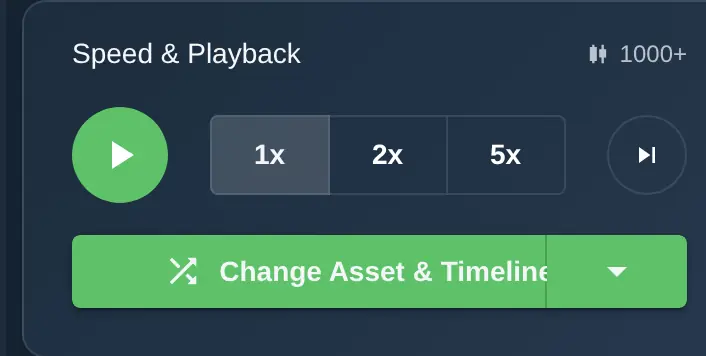
Use the playback controls at the bottom of the screen to manage the speed:
- Play / Pause — Start or stop the chart from advancing.
- Step forward — Advance one candle at a time for careful analysis.
- Speed — Set the playback speed to 1x, 2x, or 5x.
While the chart plays, you can:
- Edit your stop loss or take profit levels
- Add to your position if you want to increase your size
- Partially close to take some profit while leaving the rest running
- Close the entire position manually at any time
Step 5: See Your Results
Your trade ends one of three ways: your stop loss is hit, your take profit is hit, or you close it manually. Once the session is complete (you've reached your chosen trade limit or decided to end it), you'll see a summary of your performance.
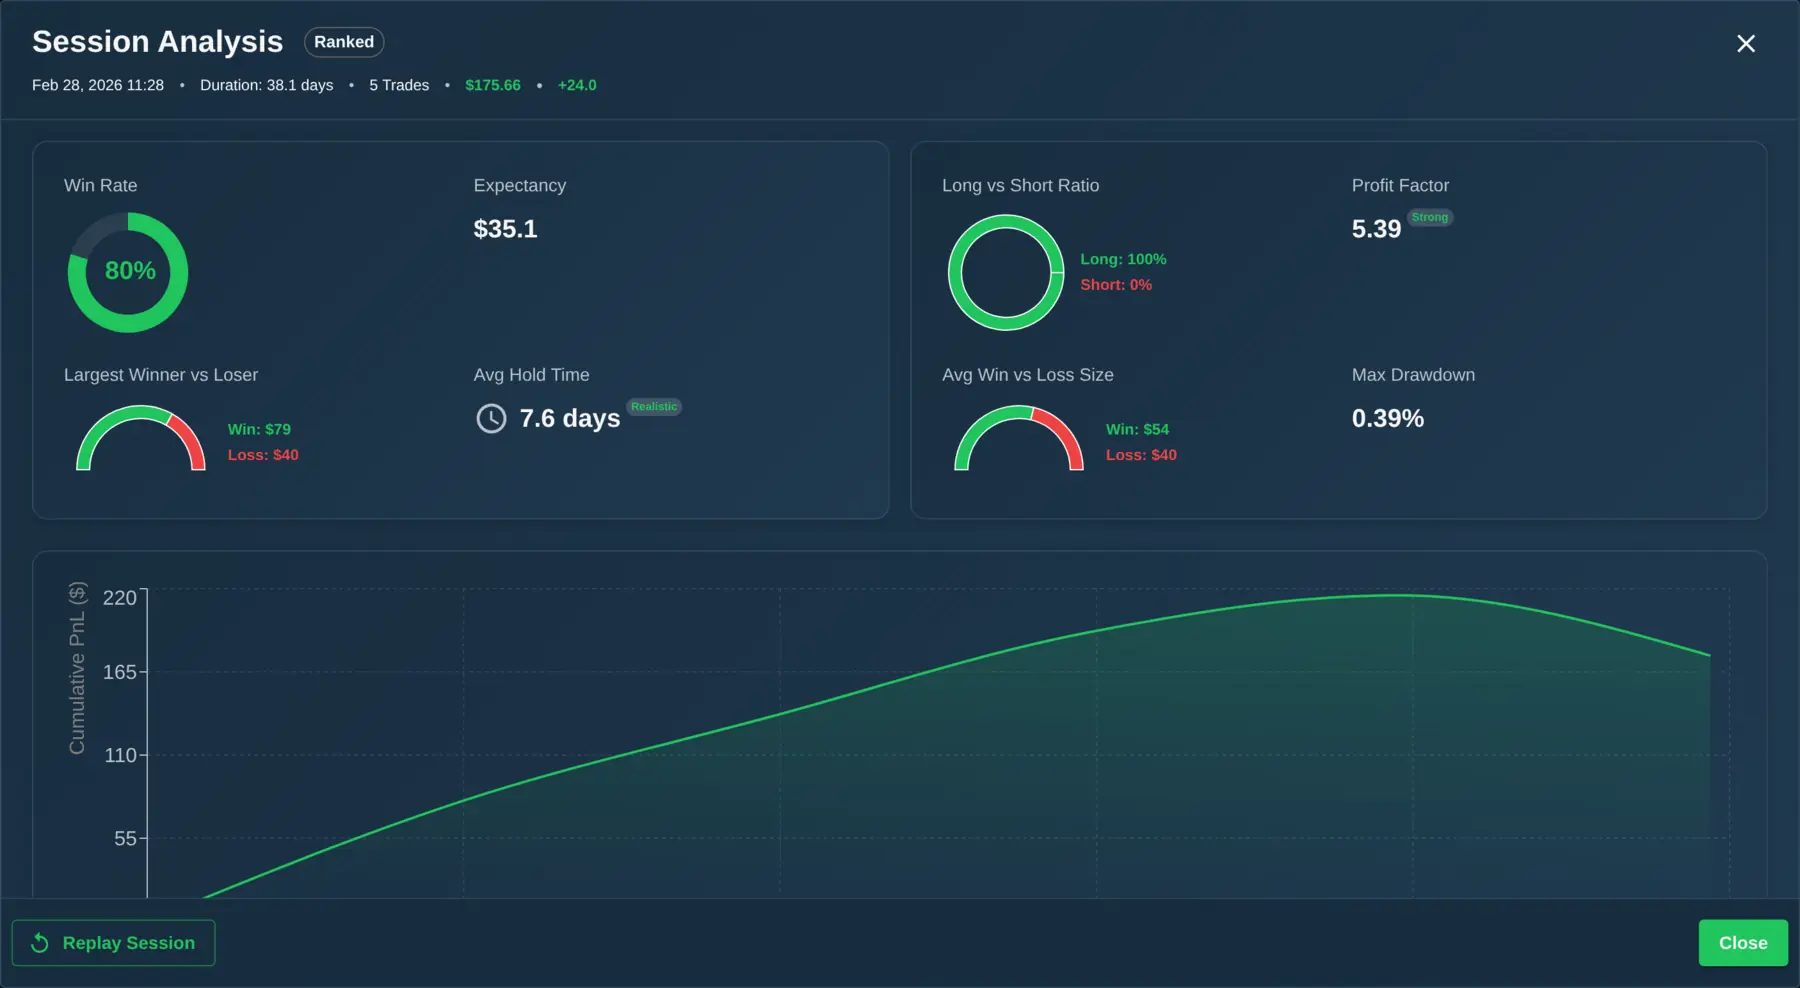
The session summary shows:
- Total P&L — How much virtual money you made or lost.
- Win rate — The percentage of trades that were profitable.
- Trades completed — How many trades you made during the session.
- Rating change — How much your skill rating went up or down (in Rated sessions).
Don't worry if your first session doesn't go well. Everyone starts somewhere, and the rating system is designed to reflect improvement over time, not one-off results.
What to Do Next
After your first session, here are three things worth trying:
- Try the Daily Challenge — Three quick trades that take just a few minutes. It's a great daily warm-up and a different format from full sessions. Learn how Daily Challenge and Patterns mode work.
- Explore Patterns mode — Practice recognizing specific chart setups like breakouts, reversals, and trend continuations. Charts move candle by candle, giving you time to think through each decision.
- Create an account — Register to save your progress, appear on leaderboards, and track your improvement over time. It's free and takes a few seconds.
The more sessions you complete, the more you'll notice your chart reading and decision-making improving. ChartingPark is designed so that every session teaches you something — whether the trade wins or loses.