Parabolic SAR Simply Explained
Learn how the Parabolic SAR indicator works, how to read its signals, and how traders practice it effectively in a simulator.
Introduction
The Parabolic SAR (Stop and Reverse) is a trend-following indicator developed by J. Welles Wilder. It helps traders identify potential reversals and provides a dynamic way to trail stop losses. The indicator is displayed as a series of dots above or below the price on a chart. Its main purpose is to show when a trend may be continuing or when it might be about to reverse.
How the Indicator Works
The Parabolic SAR is calculated using price and time. It places dots on the chart based on an acceleration factor that increases as the trend develops. Each dot represents a potential level where a trader might place a stop loss. When the trend is strong, the dots trail closely behind price; when momentum slows, they catch up faster, often triggering a reversal signal.
In simple terms:
- If the dots are below price, the trend is considered bullish (uptrend).
- If the dots are above price, the trend is considered bearish (downtrend).
How to Read the Indicator
Traders use the Parabolic SAR in two primary ways: to identify the trend direction and to spot potential reversals.
- Uptrend: Dots below price suggest holding or entering long positions.
- Downtrend: Dots above price suggest holding or entering short positions.
- Reversal: When dots switch sides (from above to below or vice versa), it signals a possible trend reversal.
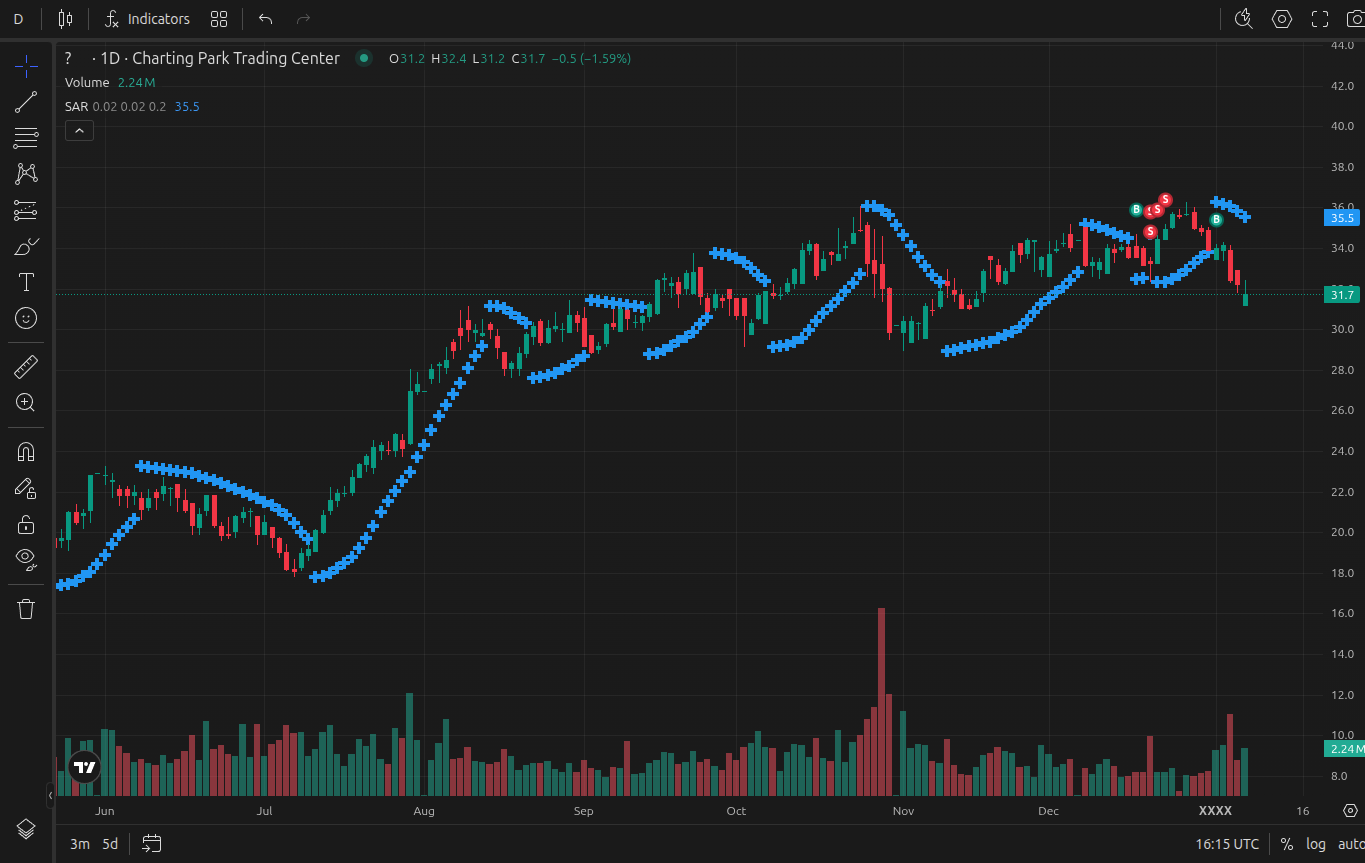
Example of Parabolic SAR dots displayed on a TradingView chart
Common Trading Strategies with Parabolic SAR
The Parabolic SAR is often used in combination with other tools to filter signals and reduce false reversals. Some strategies include:
- Trend confirmation: Use SAR alongside a moving average. For example, only take buy signals (dots below price) if price is also above the 50-period MA.
- Stop-loss trailing: Place stops at or near the SAR dots to lock in profits as the trend continues.
- Multiple timeframes: Confirm SAR signals on a higher timeframe before acting on a shorter timeframe.
Strengths and Limitations
Strengths:
- Helps capture strong trends by trailing stop levels.
- Simple visual representation makes it easy to interpret.
- Works well in trending markets.
Limitations:
- Generates false signals during sideways or choppy markets.
- Not suitable as a standalone indicator—best used with filters like moving averages or momentum oscillators.
- Can lead to frequent stop-outs if trend is weak.
Practicing with the Indicator
The best way to build confidence with the Parabolic SAR is through structured practice. In a trading simulator like ChartingPark, traders can fast-forward through historical price action to see how SAR signals play out across different markets and timeframes. This removes the need to wait days or weeks for signals in real time.
ChartingPark lets traders practice both long and short signals, experiment with different settings, and combine SAR with tools such as moving averages. You can review results with key metrics like win rate, expectancy, and cumulative return.
For more on the indicators, see CCI Simply Explained.