Commodity Channel Index (CCI) Simply Explained
Learn how the Commodity Channel Index (CCI) helps traders identify overbought and oversold conditions, spot trend shifts, and refine entries and exits.
Introduction
The Commodity Channel Index (CCI) is a momentum-based technical analysis indicator developed by Donald Lambert in the 1980s. Despite its name, it is not limited to commodities—traders apply it to stocks, forex, and cryptocurrencies. CCI helps traders identify potential overbought or oversold conditions, trend reversals, and short-term market momentum.
How the Indicator Works
CCI measures the difference between the current price and its moving average, normalized by average price deviation. In plain terms, it tells us how far the price has strayed from its typical value. Each point of the indicator reflects whether the market is behaving normally or showing unusual strength/weakness.
- Typical Price (TP): (High + Low + Close) / 3
- Moving Average (MA): Average of the Typical Price over a chosen period (default: 20)
- Mean Deviation: Average of the absolute differences between each TP and the MA
- CCI Formula: (TP – MA) / (0.015 × Mean Deviation)
The constant 0.015 is used to ensure that most CCI values fall between -100 and +100, making interpretation easier.
How to Read the Indicator
CCI fluctuates above and below zero, typically within the -100 to +100 range, but it can extend beyond these levels during strong market moves.
- +100 and above: Market may be overbought or entering a strong uptrend.
- -100 and below: Market may be oversold or entering a strong downtrend.
- Crossing zero: Indicates a potential shift in short-term momentum.
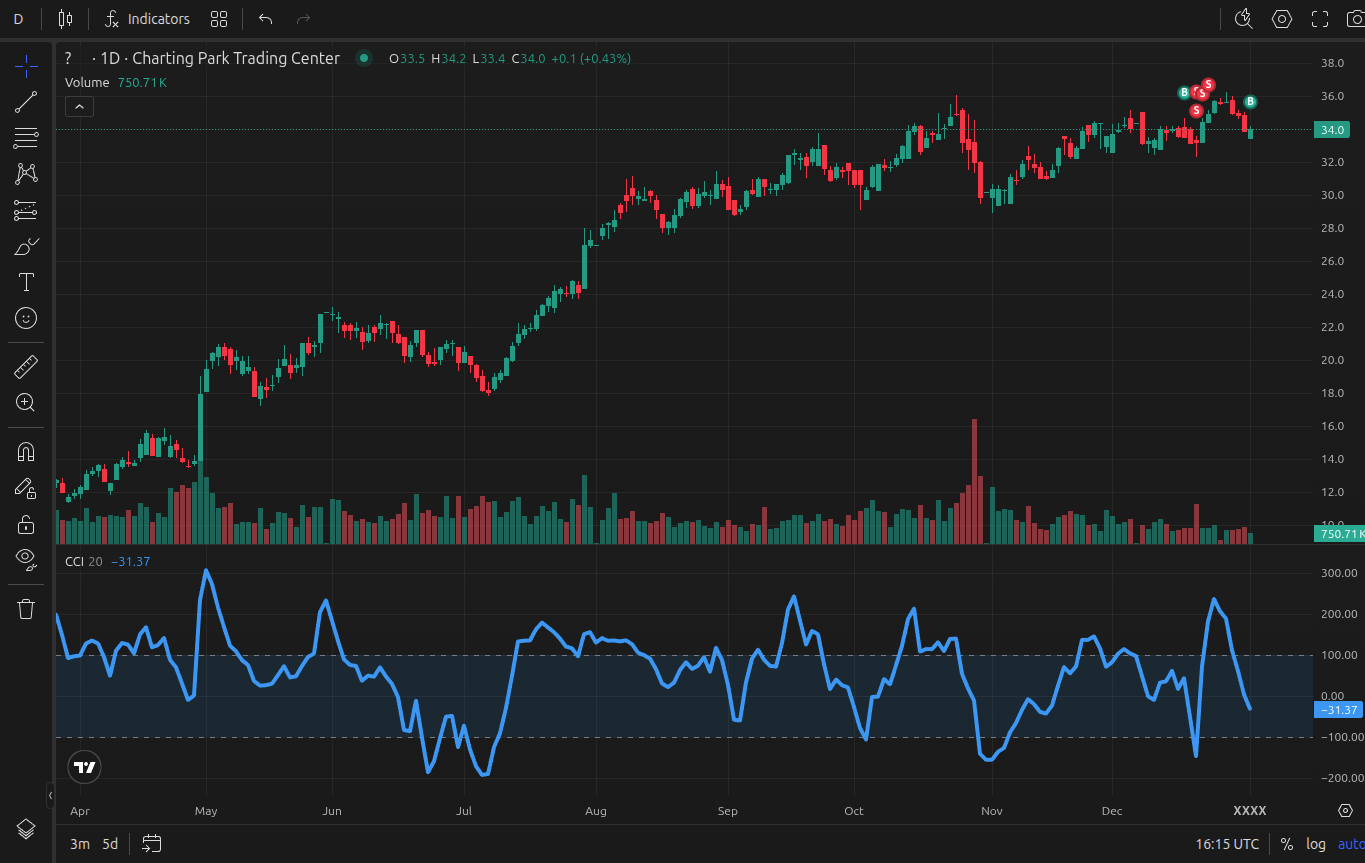
Example of CCI displayed on a TradingView chart
Common Trading Strategies with CCI
- Overbought/Oversold Reversals: Traders may sell when CCI moves above +100 and turns downward, or buy when it falls below -100 and reverses upward.
- Trend Confirmation: In strong uptrends, traders may look for CCI to remain above zero as confirmation to hold long positions. In downtrends, the opposite applies.
- Divergences: A bullish divergence occurs when price makes a lower low but CCI makes a higher low, hinting at weakening downside momentum. A bearish divergence signals the opposite.
Settings can be adjusted for different time horizons. Shorter periods (e.g., 14) make the indicator more sensitive but may create false signals, while longer periods (e.g., 50) smooth results but react slower.
Strengths and Limitations
- Strengths: Highlights potential turning points, works across different markets, and can be combined with other tools like trendlines or moving averages.
- Limitations: Prone to false signals in choppy markets, does not predict trend direction alone, and requires confirmation from other analysis methods.
Conclusion
The Commodity Channel Index is a versatile momentum tool that helps traders identify overbought and oversold conditions, potential reversals, and confirm market trends. While not perfect on its own, combined with other forms of technical analysis it can be an effective part of a trading system.
Because CCI generates frequent signals, the best way to build skill is through structured practice. A trading game like ChartingPark allows you to fast-forward through historical price action and test how CCI performs in different market conditions. Instead of waiting days for setups, you can review dozens of trades in a single session, helping refine your ability to separate strong signals from noise.