Moving Average Simply Explained
A clear guide to understanding Moving Averages, how they work, and how traders use them for practice trading and technical analysis.
Introduction
The Moving Average (MA) is one of the most widely used indicators in technical analysis. It smooths out price fluctuations to help traders identify the underlying trend. Whether you are practicing in a trading simulator or analyzing live markets, moving averages provide a simple yet powerful way to understand price direction and momentum.
How the Moving Average Works
A moving average takes the average price of an asset over a defined period and plots it as a line on the chart. Each new data point replaces the oldest one, creating a “moving” effect. For example, a 10-day simple moving average (SMA) calculates the mean of the last 10 closing prices.
- Simple Moving Average (SMA): Equal weight to all periods.
- Exponential Moving Average (EMA): Gives more weight to recent prices for faster reaction.
- Weighted Moving Average (WMA): Custom weighting scheme.
This smoothing effect reduces noise and highlights the overall direction of the market.
How to Read the Moving Average
Traders use moving averages to interpret trend direction and potential entry or exit points:
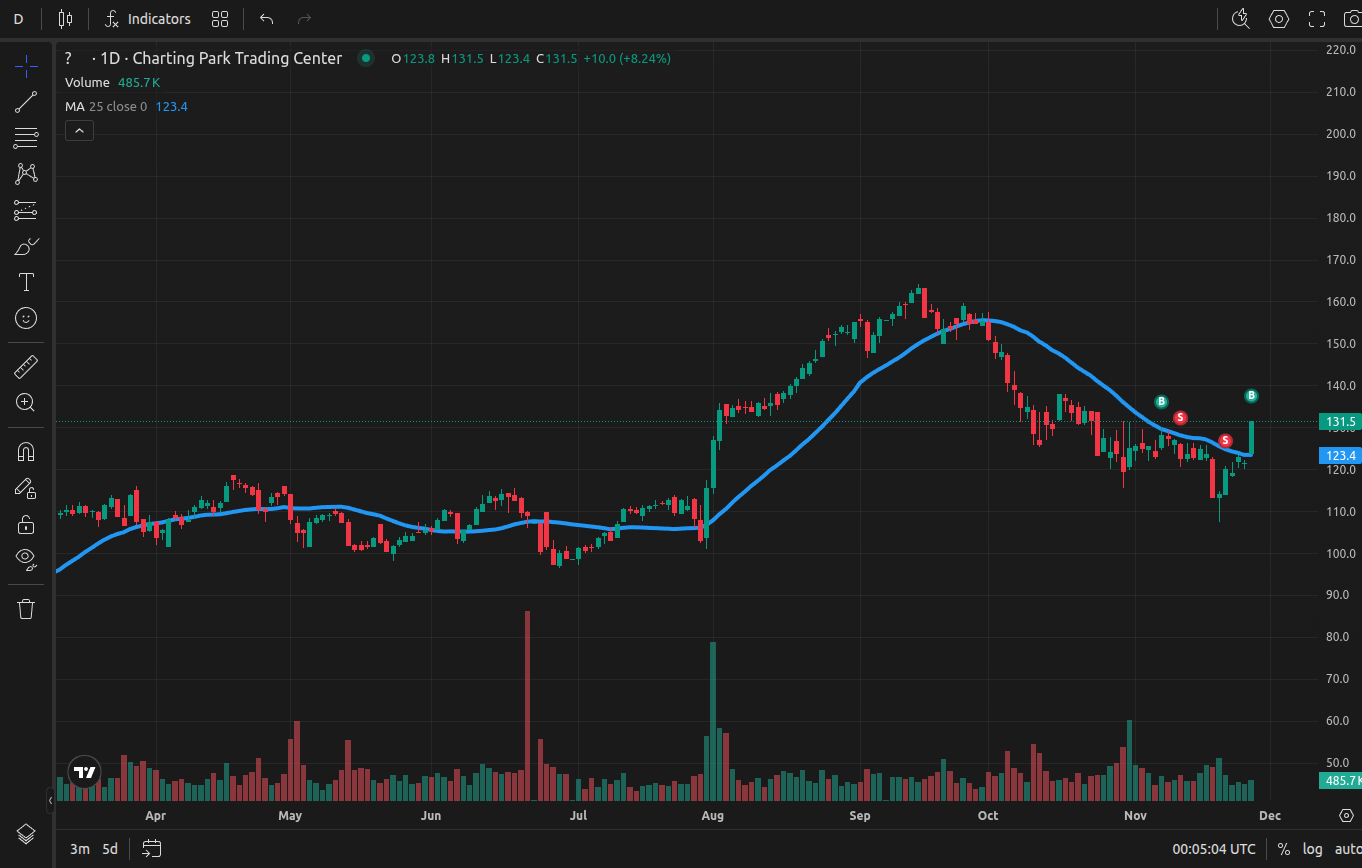
- Above the MA: Price trading above the moving average suggests an uptrend.
- Below the MA: Price trading below the moving average suggests a downtrend.
- Crossovers: When a shorter MA (e.g., 20-day) crosses above a longer MA (e.g., 50-day), it may signal bullish momentum. The opposite is considered bearish.

Example of Moving Averages displayed on a TradingView chart
Common Trading Strategies with Moving Averages
Some practical ways traders use moving averages include:
- Trend Following: Enter trades in the direction of the MA slope. A rising 50-day MA suggests bullish conditions.
- Crossovers: The 50/200-day crossover (often called the “Golden Cross” or “Death Cross”) is a popular long-term signal.
- Dynamic Support and Resistance: Price often reacts around commonly used averages like the 20 EMA.
Different settings matter: shorter MAs (10–20) are sensitive and suited for short-term traders, while longer MAs (100–200) are better for identifying big-picture trends.
Strengths and Limitations
Strengths:
- Smooths out noise and clarifies trend direction.
- Simple and intuitive to apply on any chart.
- Works across all timeframes and instruments.
Limitations:
- Lags behind price — signals come after moves begin.
- Prone to false signals in choppy, sideways markets.
- Should be combined with other tools like RSI or support/resistance analysis.
Practicing with the Moving Average
The best way to learn moving averages is through deliberate practice. Inside a trading simulator like ChartingPark, you can apply moving averages on TradingView charts and fast-forward through historical price action. This allows you to test crossovers, trend following, and risk management without waiting in real time. Over multiple sessions, you’ll see how moving averages behave in different conditions.
For deeper practice, check related articles such as Practice Price Action Trading.
Conclusion
Moving Averages are a foundational tool for traders to spot trends, confirm signals, and manage entries. While they aren’t foolproof, practicing with them in a trading simulator helps you understand their strengths and weaknesses. Over time, this builds confidence and discipline in applying them as part of a structured trading plan.