On-Balance Volume (OBV) Simply Explained
Learn how On-Balance Volume (OBV) helps traders confirm trends and spot divergences by analyzing price and volume together.
Introduction
On-Balance Volume (OBV) is a volume-based momentum indicator created by Joseph Granville in the 1960s. The idea is simple: volume precedes price. By combining volume and price direction, OBV helps traders identify whether money is flowing into or out of an asset. It is often used to confirm the strength of a trend or to spot early signs of reversals.
How the OBV Indicator Works
OBV is calculated by adding or subtracting the day’s volume depending on price movement:
- If the closing price is higher than the previous close → OBV = Previous OBV + Volume
- If the closing price is lower than the previous close → OBV = Previous OBV – Volume
- If the price is unchanged → OBV stays the same
Unlike oscillators such as RSI or Stochastic, OBV is a cumulative line. Traders look at the direction of OBV rather than its numeric value.
How to Read the OBV Indicator
The OBV line is typically plotted under the price chart. Here’s how to interpret it:
- Trend Confirmation: If both price and OBV move upward, it signals a strong bullish trend. If both move downward, the bearish trend is confirmed.
- Divergence: If price makes higher highs while OBV makes lower highs, it may signal weakening buying pressure (bearish divergence). Conversely, higher OBV with flat price may suggest accumulation and a potential breakout (bullish divergence).
- Breakouts: A sudden shift in OBV direction may foreshadow a breakout before the price reacts.
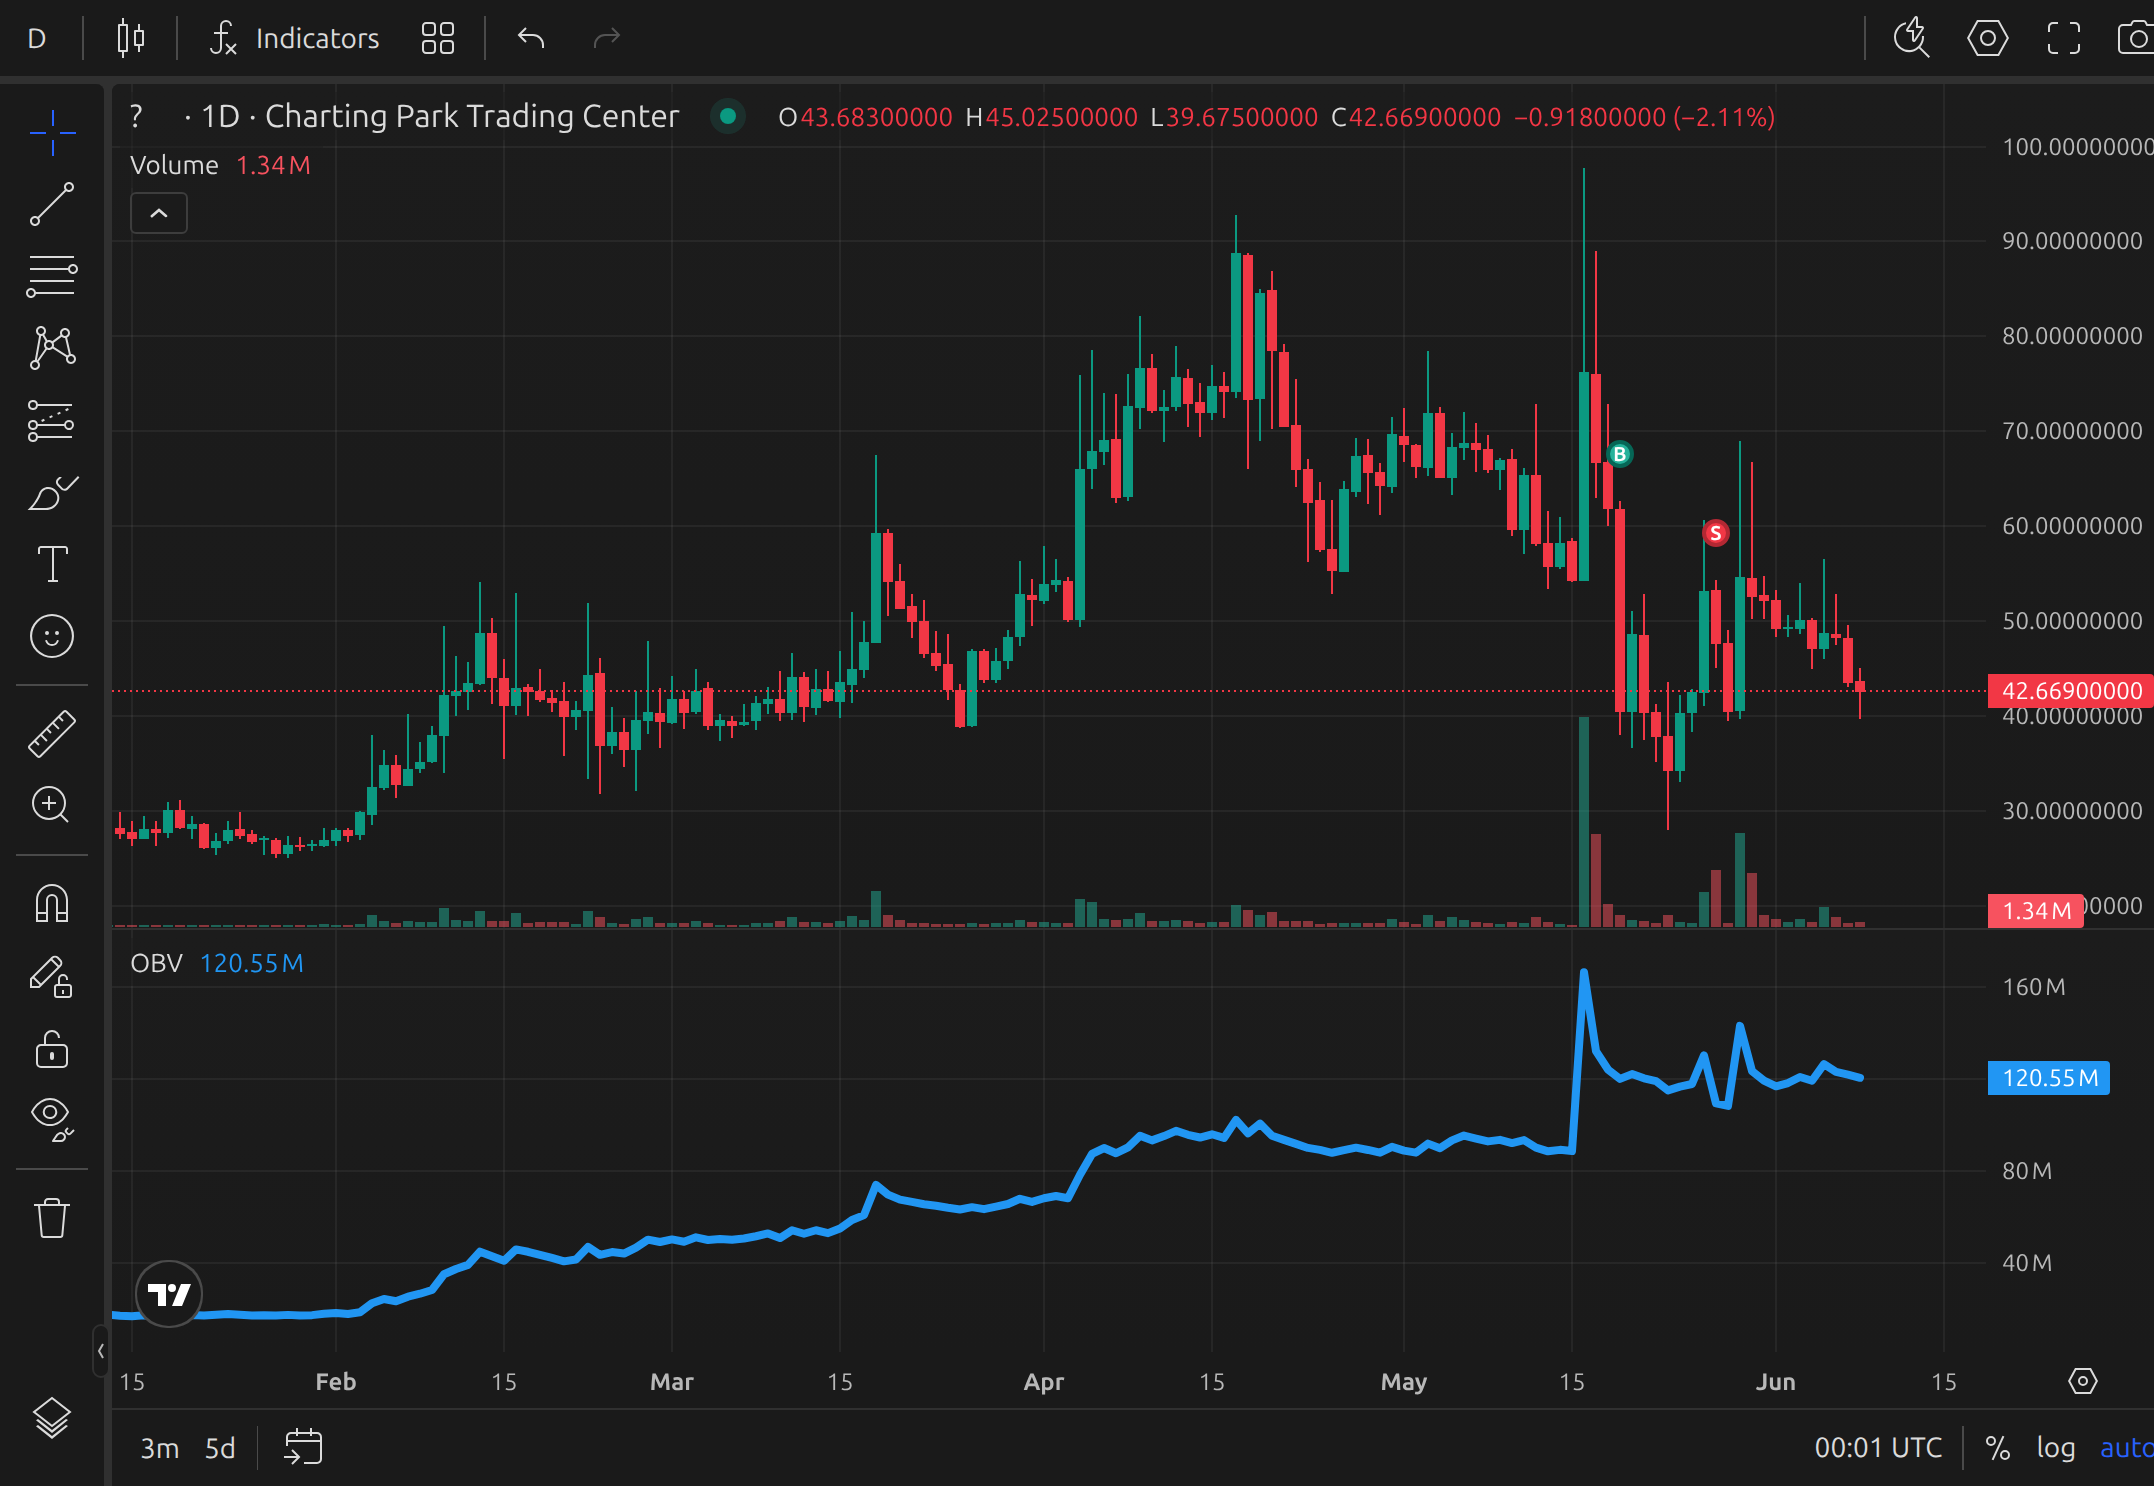
Example of OBV displayed on a TradingView chart
Common Trading Strategies with OBV
- Trend Confirmation: Use OBV to verify the strength of an ongoing trend before entering trades.
- Divergence Trading: Spotting divergence between OBV and price can help anticipate reversals.
- Breakout Signals: Watch for OBV line breakouts from consolidation as an early warning of strong moves.
OBV is often combined with indicators like Moving Averages or RSI to filter out false signals and improve reliability.
Strengths and Limitations
Strengths:
- Straightforward calculation and interpretation.
- Helps confirm whether institutional money is supporting a price move.
- Effective for spotting divergences and potential trend reversals.
Limitations:
- OBV can produce false signals in choppy, low-volume markets.
- Does not provide overbought/oversold levels like oscillators.
- Best used as a confirmation tool, not a standalone trading system.
Practicing with OBV
The best way to understand OBV is by practicing in a trading simulator where you can test how OBV interacts with real price action. Platforms like ChartingPark allow you to fast-forward through historical data, apply OBV on charts, and make trading decisions without risking real money. This is especially helpful for practicing divergence recognition and trend confirmation in different market conditions.