Relative Strength Index (RSI) Simply Explained
A clear and practical explanation of the RSI indicator, how it works, how to read it, and how to practice with it in a trading simulator.
The Relative Strength Index (RSI) is one of the most widely used momentum indicators in technical analysis. It helps traders identify when a market is potentially overbought or oversold, offering clues about possible reversals or corrections.
How the RSI Works
The RSI measures the speed and magnitude of recent price changes. It compares the average gain of up-closing candles to the average loss of down-closing candles over a set period, most commonly 14 periods.
The resulting value is plotted as an oscillator ranging from 0 to 100. Traders use it to assess momentum rather than absolute price levels.
Example: If the last 14 periods saw an average gain twice as large as the average loss, the RSI will be closer to the higher end of the scale.
How to Read the RSI
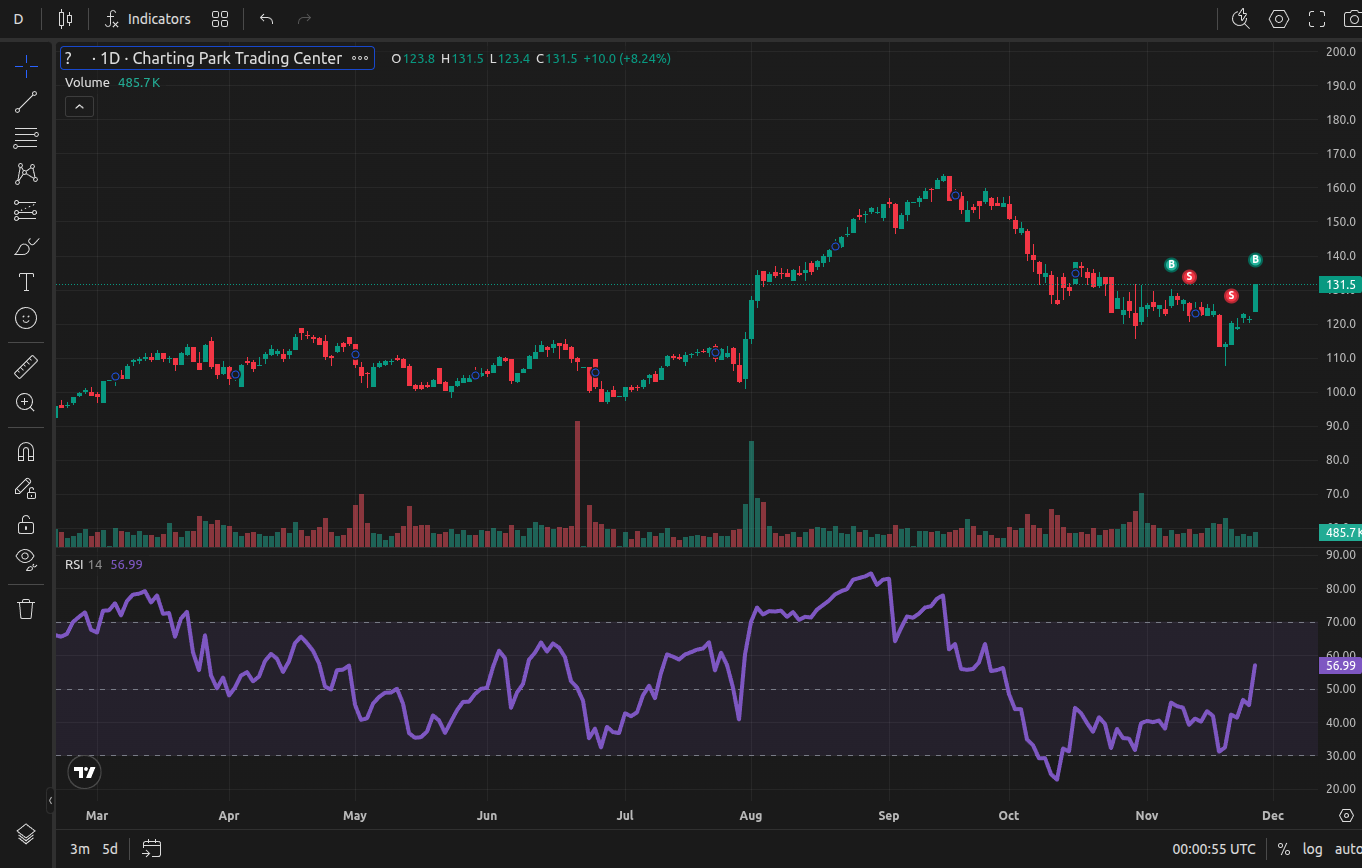
- Above 70: Market is considered overbought — potential for a pullback.
- Below 30: Market is considered oversold — potential for a rebound.
- Midpoint 50: Neutral level; often used to confirm the prevailing trend.

Example of RSI displayed on a TradingView chart
Common Trading Strategies with RSI
- Overbought/Oversold Reversals: Look for price to turn after hitting 70 or 30 levels.
- Divergence: If price makes a new high but RSI does not, it may signal weakening momentum.
- Trend Confirmation: In strong trends, RSI may stay above 50 (bullish) or below 50 (bearish) for extended periods.
Traders often combine RSI with other tools such as Moving Averages or support/resistance zones for confirmation.
Strengths and Limitations
Strengths:
- Simple to read and interpret.
- Useful for spotting overbought/oversold conditions quickly.
- Helps identify divergences that can signal early reversals.
Limitations:
- In strong trends, RSI can stay in overbought/oversold zones longer than expected.
- False signals may occur if used without confirmation.
Practicing with the RSI
Understanding RSI signals is best done through practice. Using a trading simulator like ChartingPark, you can fast-forward through historical price data and test RSI setups across different market conditions. This allows traders to experience how RSI behaves in trends, ranges, and volatile markets without risking capital.
For further reading, see related guides such as How ChartingPark Works