Average Directional Index (ADX) Simply Explained
Learn how the Average Directional Index (ADX) helps traders measure trend strength, interpret signals, and practice strategies effectively.
Introduction
The Average Directional Index (ADX) is a popular technical indicator used to measure the strength of a market trend. Unlike some indicators that focus on the direction of price movement, ADX helps traders answer a key question: is the market trending strongly, or is it moving sideways? Understanding this distinction is vital when deciding whether to apply trend-following strategies or range-based approaches.
How the Indicator Works
Developed by J. Welles Wilder, the ADX is part of the broader Directional Movement System, which includes the +DI and –DI (Directional Indicators). Here’s the basic logic:
- +DI: Measures upward price movement.
- –DI: Measures downward price movement.
- ADX: A smoothed average of the difference between +DI and –DI, showing the strength of the trend (without indicating direction).
The ADX value typically ranges from 0 to 100. Higher values indicate stronger trends, while lower values point to weaker or sideways markets.
How to Read the Indicator
- ADX below 20: Weak or sideways market (low trend strength).
- ADX above 25: Trend is gaining strength.
- ADX above 40: Very strong trend in place.
It’s important to remember that ADX itself does not tell you the direction of the trend — only how strong it is. For direction, traders use the relationship between +DI and –DI:
- If +DI > –DI, the trend is up.
- If –DI > +DI, the trend is down.
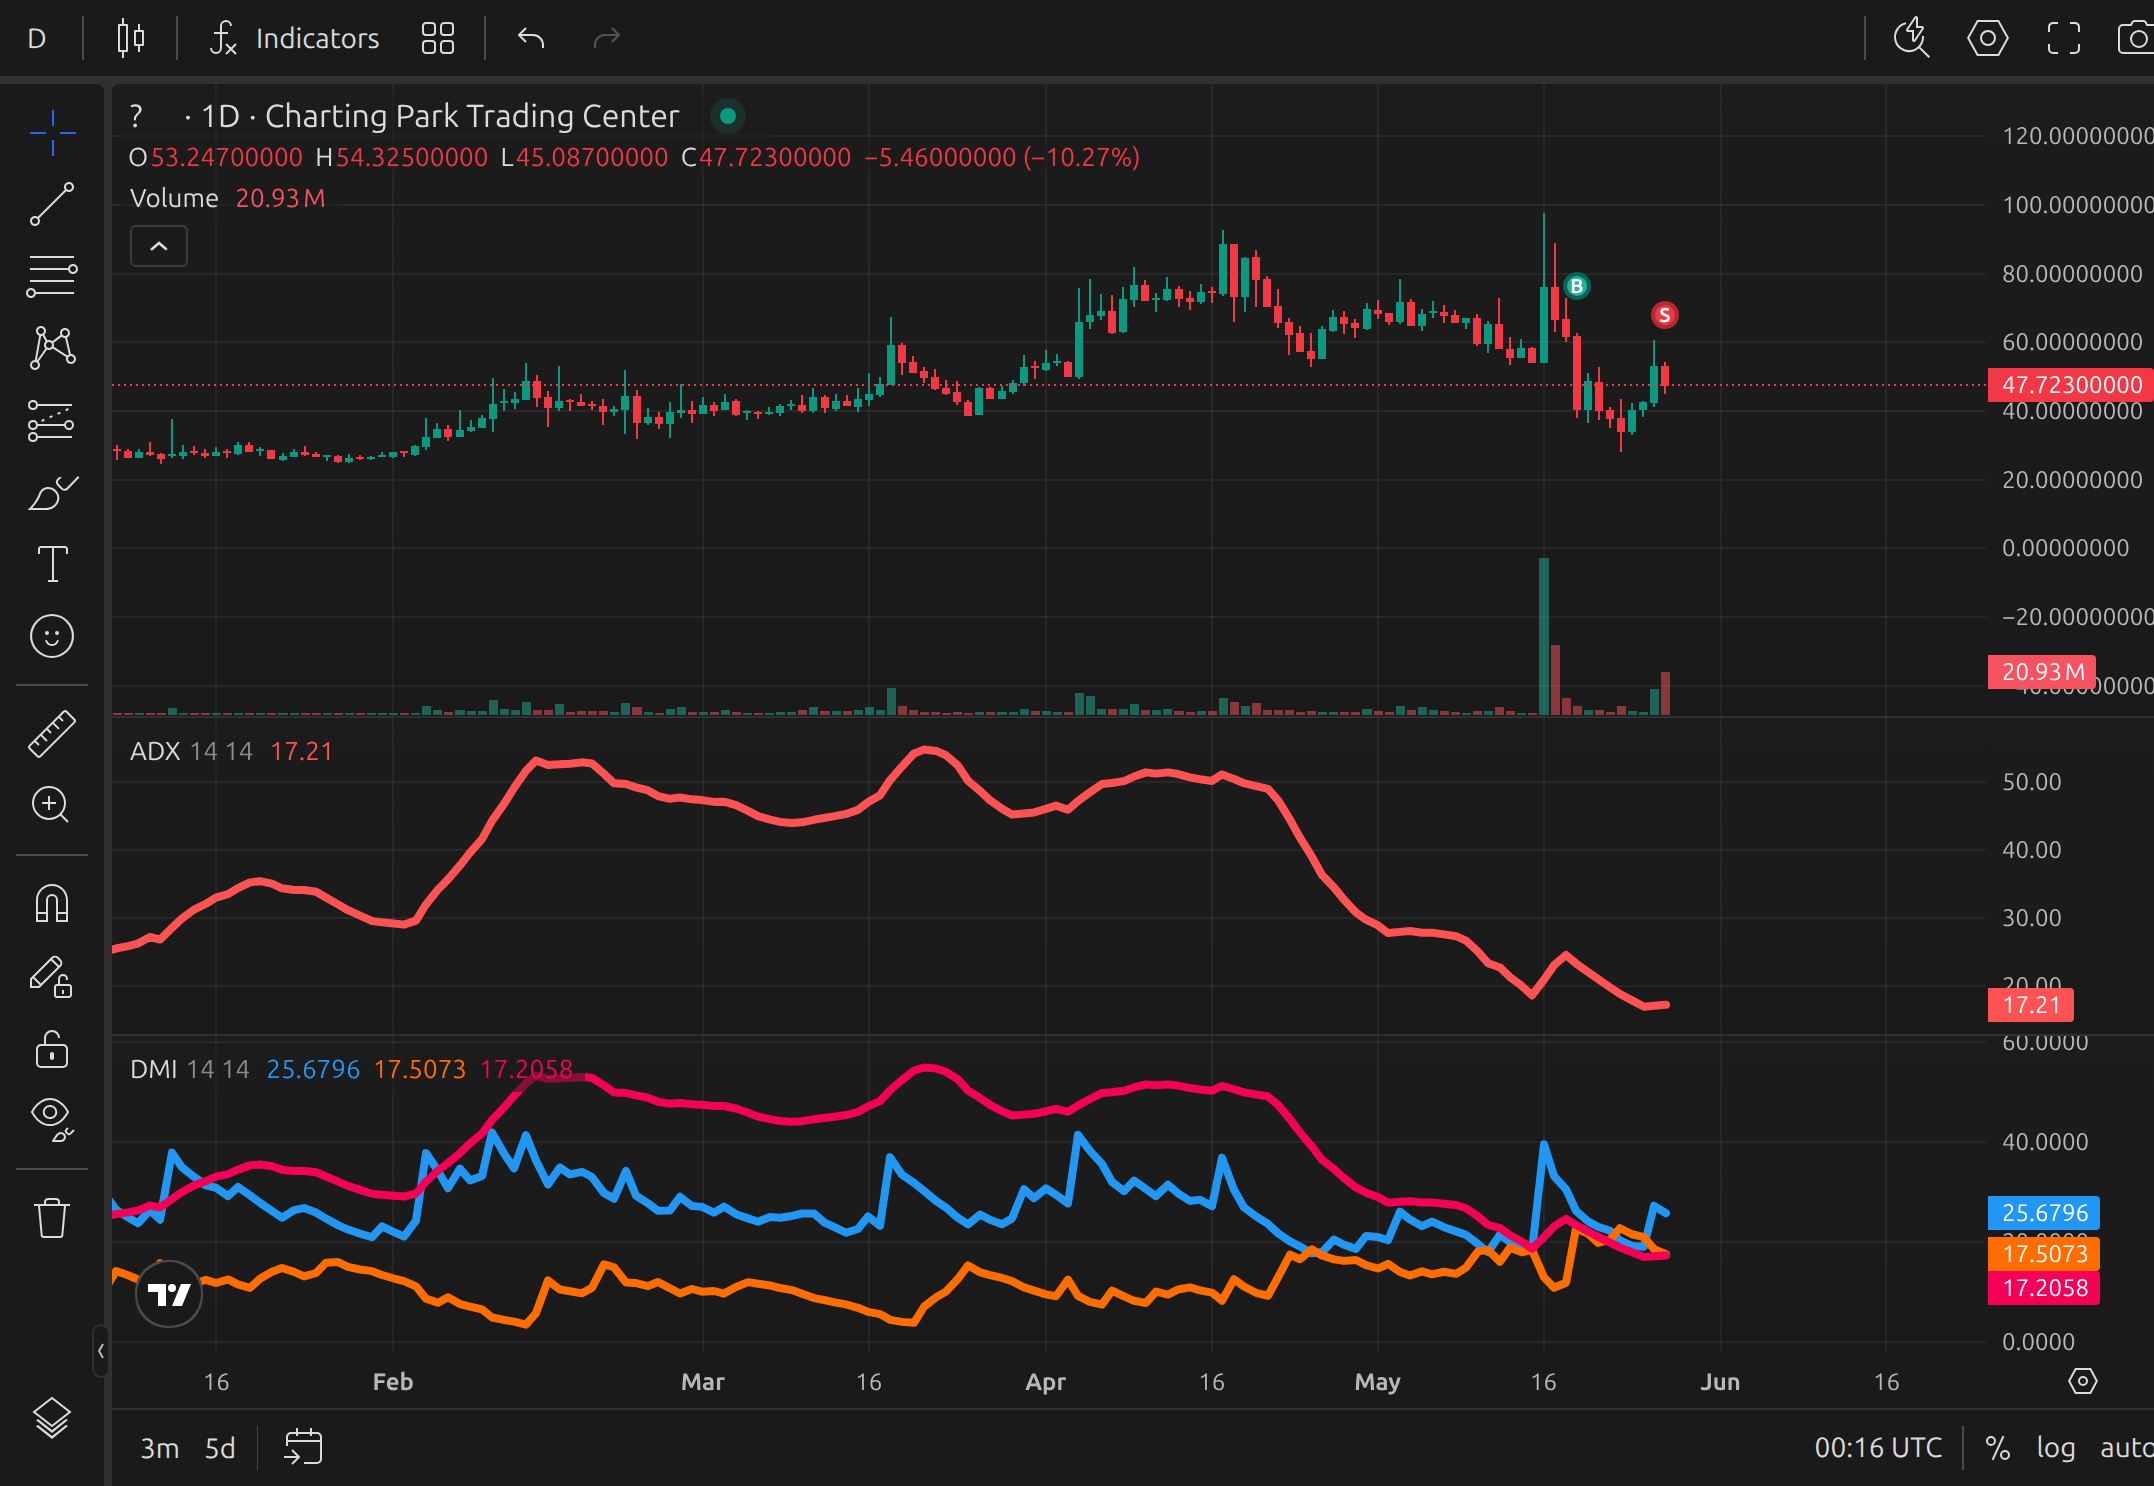
Example of ADX and DI lines displayed on a chart
Common Trading Strategies with ADX
- Trend Confirmation: Use ADX > 25 to confirm trend strength before entering trades with moving averages or breakouts.
- Range Identification: When ADX is below 20, trend-following strategies may underperform, so range-trading strategies like support/resistance can work better.
- Crossovers: +DI crossing above –DI while ADX is rising may signal a potential long trade setup; the opposite for short setups.
Traders often combine ADX with indicators like Moving Averages or RSI for confirmation, rather than relying on it alone.
Strengths and Limitations
Strengths:
- Clearly identifies strong vs. weak market conditions.
- Helps traders avoid false signals during sideways markets.
Limitations:
- Does not show direction on its own (needs +DI and –DI).
- Lags price because it’s a smoothed indicator.
- May give late signals in fast-moving markets.
Practicing with the Indicator
Reading ADX signals effectively requires practice. In a live market, waiting for ADX to confirm a trend can take time. This is where a trading game such as ChartingPark becomes useful. You can:
- Fast-forward through historical price action to see how ADX behaves in different conditions.
- Test trend-following strategies when ADX is high, and range strategies when ADX is low.
- Review completed sessions to measure how ADX-based strategies affect your win rate, expectancy, and risk/reward metrics.