Volume Indicators (e.g., OBV, Money Flow Index) Simply Explained
Learn how volume indicators like On-Balance Volume (OBV) and Money Flow Index (MFI) help traders confirm trends, spot reversals, and practice trading effectively.
Introduction
Volume indicators are technical tools that help traders analyze the strength behind price movements. While price shows direction, volume reveals conviction. Indicators such as On-Balance Volume (OBV) and the Money Flow Index (MFI) combine price and volume data to identify trends, confirm breakouts, and warn of potential reversals.
How Volume Indicators Work
Volume indicators measure how much market activity supports price changes. They don’t predict direction on their own but provide context about buying and selling pressure. Two of the most widely used are:
- On-Balance Volume (OBV): Adds volume on up days and subtracts volume on down days. The cumulative line shows whether volume is flowing into or out of an asset.
- Money Flow Index (MFI): Combines price and volume into an oscillator. It measures the intensity of money flowing in and out, scaled between 0 and 100.
Example: If a stock rises 2% on high volume and falls 1% on low volume, OBV will still move up, signaling net buying pressure. Meanwhile, MFI would show strong money inflows relative to outflows.
How to Read Volume Indicators
- OBV: If OBV rises while price consolidates, it suggests accumulation and a possible breakout higher. If OBV falls while price is flat, it may signal distribution and potential weakness.
- MFI: Values above 80 are considered overbought, while below 20 are oversold. Divergences between MFI and price often signal reversals.
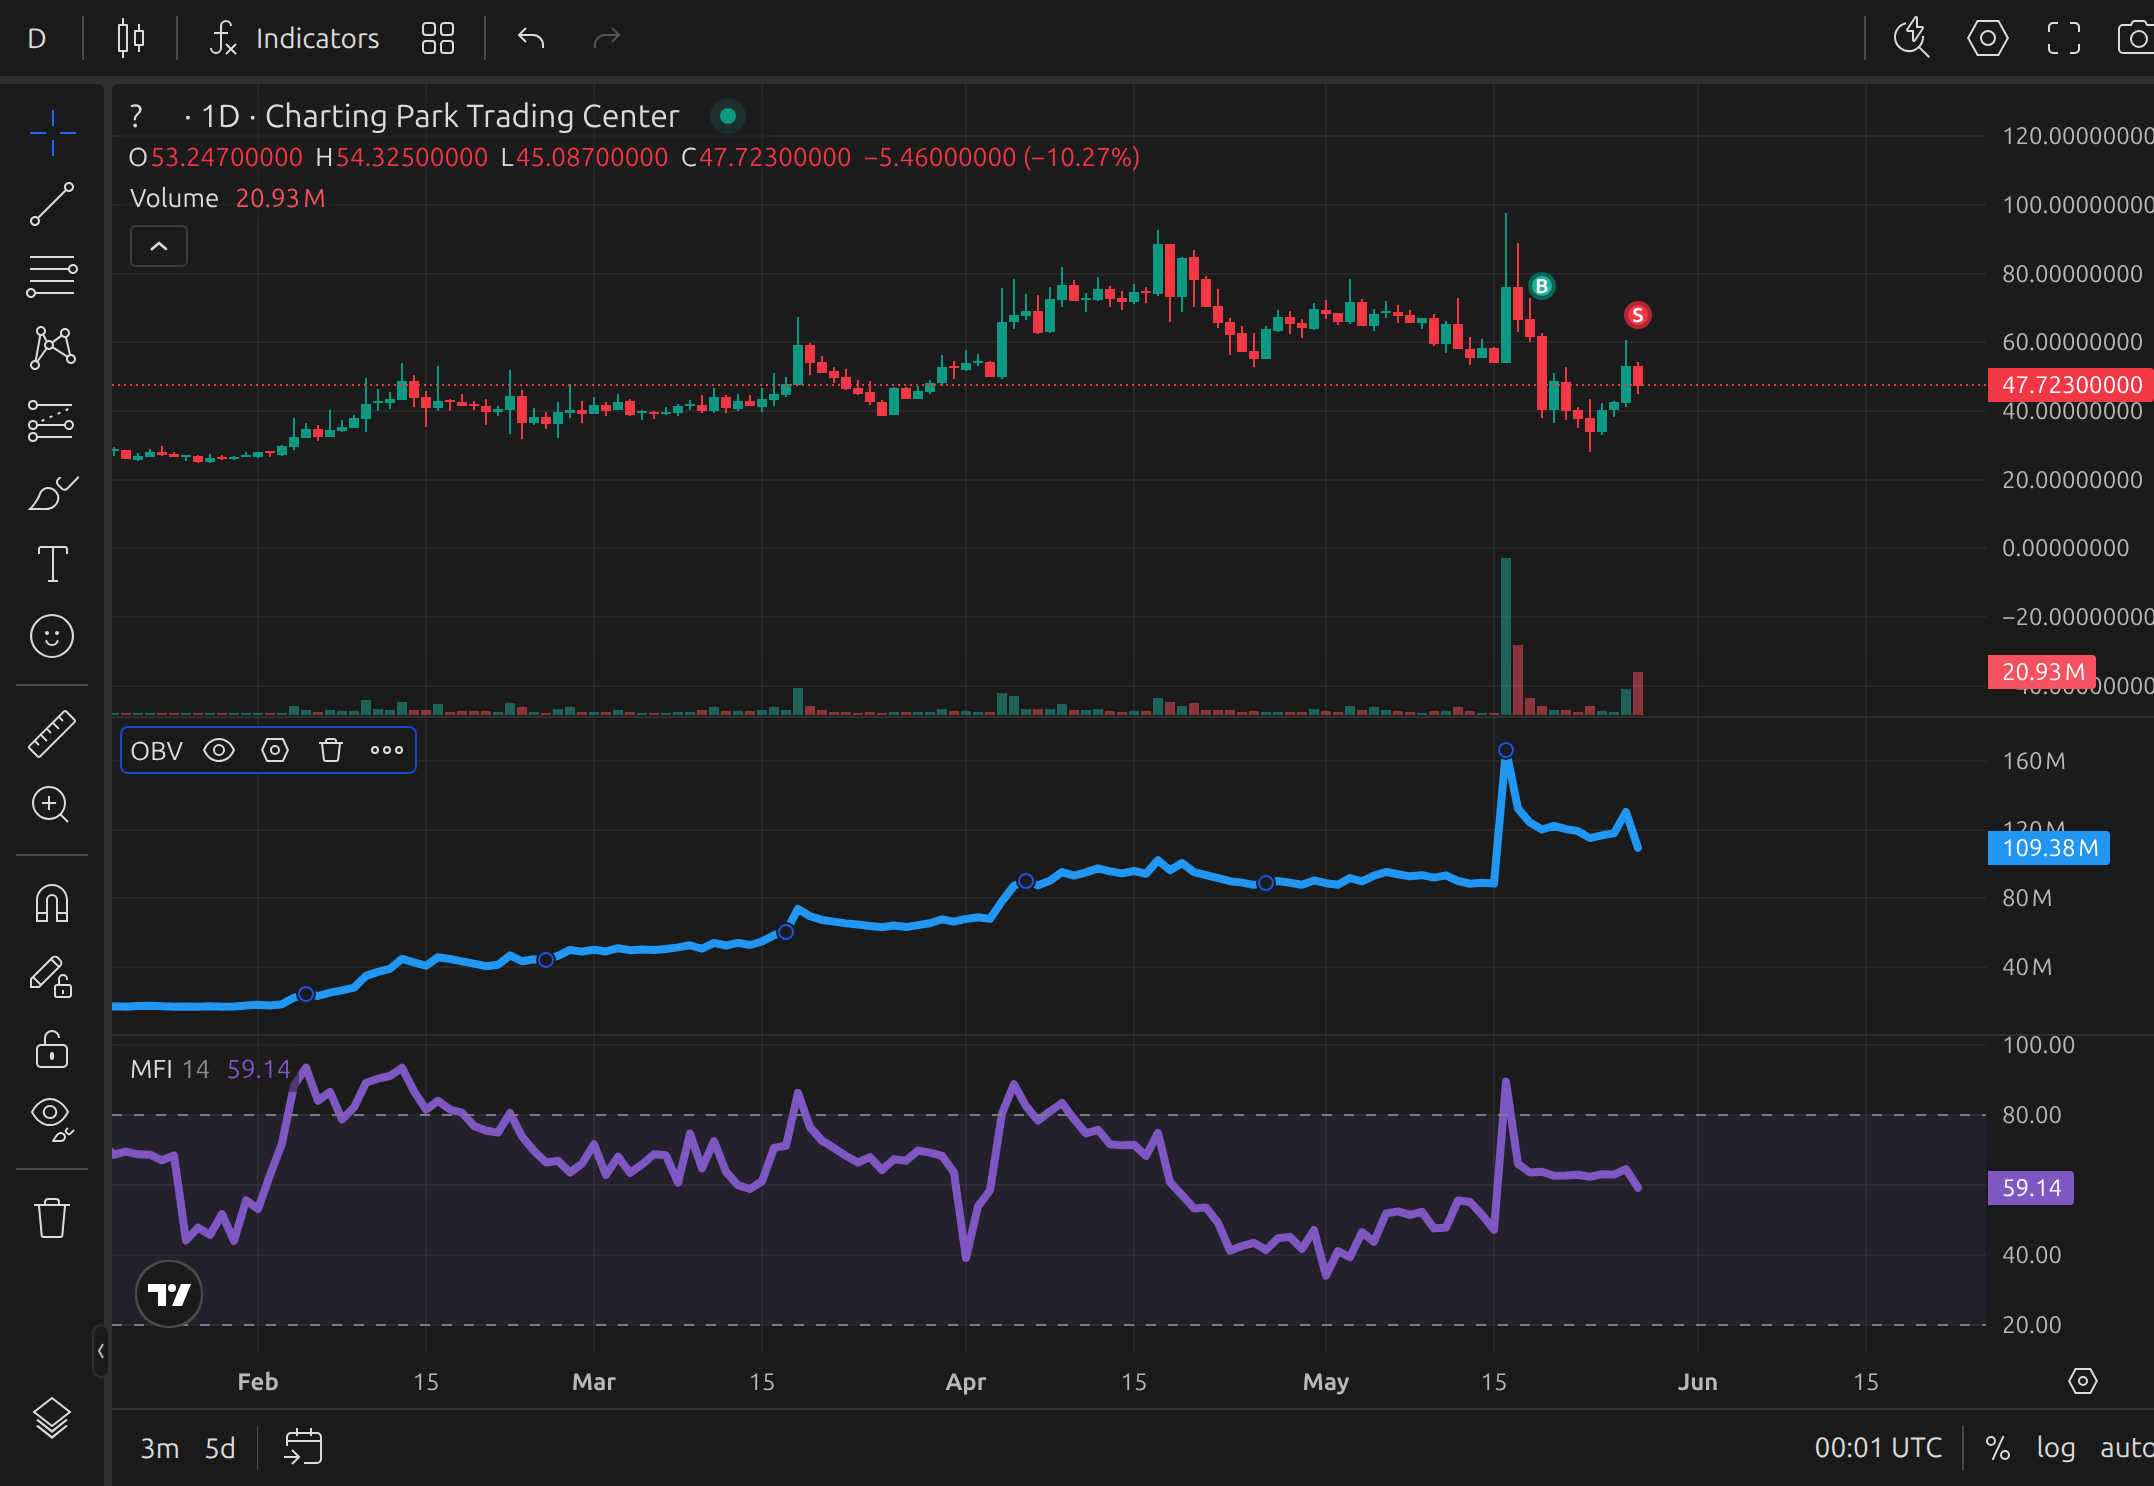
Example of OBV and Money Flow Index displayed on a TradingView chart
Common Trading Strategies with Volume Indicators
- Trend Confirmation: Use OBV to confirm whether volume supports the current trend. For example, in an uptrend, OBV should make higher highs alongside price.
- Divergence Signals: If price makes new highs but MFI or OBV do not, this divergence can warn of weakening momentum.
- Breakout Validation: A surge in OBV during a breakout adds confidence that the move has strength behind it. Traders often combine this with moving averages or RSI for confirmation.
Strengths and Limitations
Strengths:
- Provide insight into market conviction behind price moves.
- Useful for spotting accumulation or distribution before price reacts.
- Combine well with trend and momentum indicators for confirmation.
Limitations:
- Can give false signals in choppy or low-volume markets.
- Do not provide exact entry/exit levels; best used with other tools.
- MFI thresholds (80/20) may not always align with market conditions.
Conclusion
Volume indicators such as OBV and MFI add an extra dimension to technical analysis by revealing the strength behind price moves. Used wisely, they can help traders confirm trends, anticipate reversals, and manage risk more effectively. However, they should never be relied on alone — always combine them with price action and other tools.
For a deeper understanding of indicators, check out our article on Ichimoku Cloud Simply Explained as well.