Ichimoku Cloud Simply Explained
A short guide to the Ichimoku Cloud indicator: how it works, how to read it, and how traders use it in practice trading.
Introduction
The Ichimoku Cloud, also called Ichimoku Kinko Hyo, is a technical indicator that shows support and resistance levels, trend direction, and momentum all in one chart. Originally developed by Goichi Hosoda, a Japanese journalist, in the 1930s, the Ichimoku Cloud has become popular with traders who want a complete market view at a glance.
How the Ichimoku Cloud Works
The Ichimoku Cloud consists of five main lines calculated from historical price data:
- Tenkan-sen (Conversion Line): Average of the highest high and lowest low over the past 9 periods.
- Kijun-sen (Base Line): Average of the highest high and lowest low over the past 26 periods.
- Senkou Span A: Average of Tenkan-sen and Kijun-sen, projected 26 periods into the future.
- Senkou Span B: Average of the highest high and lowest low over the past 52 periods, projected 26 periods into the future.
- Chikou Span (Lagging Line): Current closing price plotted 26 periods back.
The area between Senkou Span A and Senkou Span B forms the “cloud” (Kumo). This shaded area highlights potential support and resistance zones.
How to Read the Indicator
The Ichimoku Cloud provides multiple signals:
- Trend Direction: Price above the cloud suggests an uptrend; price below the cloud suggests a downtrend.
- Cloud Thickness: A thick cloud means stronger support or resistance; a thin cloud signals weaker zones.
- Crossovers: When Tenkan-sen crosses above Kijun-sen, it’s considered bullish. A cross below is bearish.
- Chikou Span Confirmation: If the lagging line is above price, the bullish signal is stronger, and vice versa.
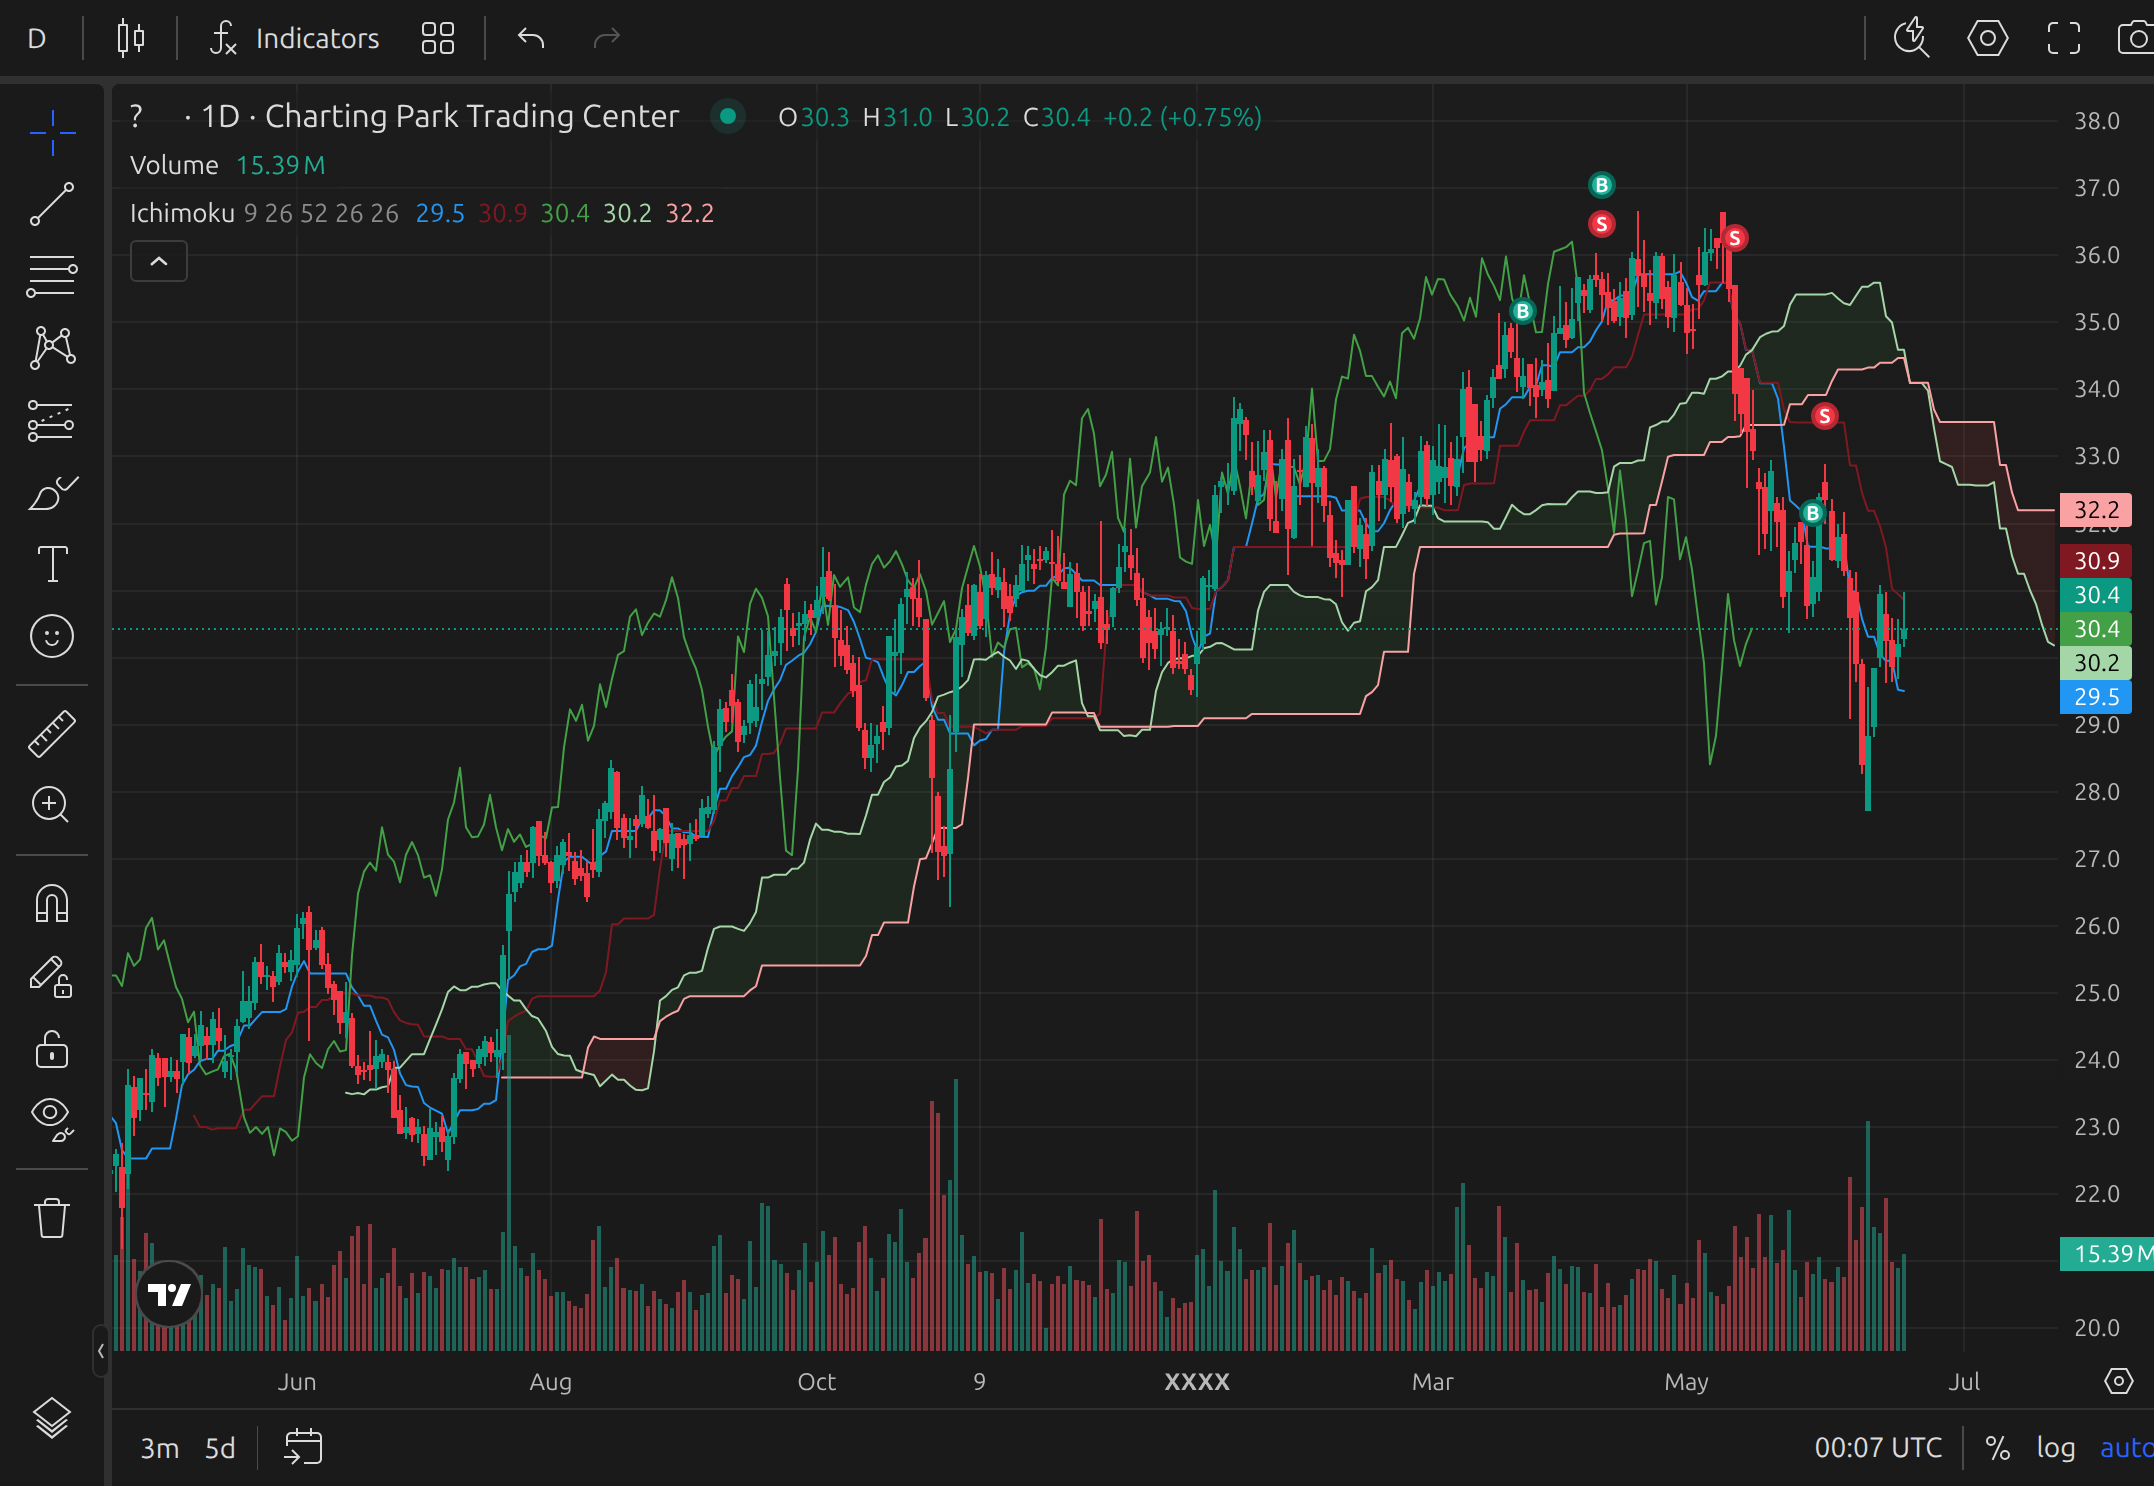
Example of Ichimoku Cloud displayed on a TradingView chart
Common Trading Strategies with Ichimoku Cloud
- Trend Following: Enter long positions when price is above the cloud and Tenkan-sen crosses above Kijun-sen; enter shorts when below the cloud with a bearish crossover.
- Support and Resistance: Use the cloud’s boundaries (Senkou Span A and B) as dynamic support and resistance levels.
- Different Settings: Default settings (9, 26, 52) reflect Japanese trading weeks. Some traders adjust to 10, 30, 60 or other values for different markets.
- Combinations: Many traders combine Ichimoku with RSI or MACD for additional confirmation.
Strengths and Limitations
Strengths:
- Provides a comprehensive view of trend, momentum, and support/resistance in one indicator.
- Useful across different timeframes and instruments.
Limitations:
- May look cluttered for beginners due to multiple lines.
- Lagging nature of some signals can give late entries in fast markets.
- Works best in trending markets but less effective in sideways ranges.
Practicing with the Indicator
To truly understand Ichimoku Cloud signals, traders should practice reading and applying them in live-like conditions. With a trading simulator like ChartingPark, you can fast-forward through historical charts, apply the Ichimoku Cloud, and see how trades would have played out without risking capital.
Inside ChartingPark, you can test strategies in Rated Sessions or Drills, track your expectancy, win rate, and cumulative returns, and refine your approach over time.
Conclusion
The Ichimoku Cloud is a versatile indicator that combines trend, momentum, and support/resistance into a single charting system. By practicing with it in a trading simulator, traders can gain confidence in interpreting signals and improve their decision-making. Practice this indicator risk-free on ChartingPark.