Supertrend Simply Explained
Learn how the Supertrend indicator works, how to read its signals, and how to practice trading it effectively using simulators.
Introduction
The Supertrend indicator is a trend-following technical analysis tool that helps traders identify the prevailing market direction and potential entry or exit points. Plotted directly on price charts, it provides simple buy or sell signals by flipping between bullish and bearish zones. Its purpose is to simplify decision-making for traders who want to follow trends and avoid false signals from noisy price action.
How the Supertrend Indicator Works
The Supertrend is calculated using the Average True Range (ATR) to measure volatility. At each point:
- A baseline is determined from the ATR and price.
- If price closes above the calculated level, the indicator switches to bullish and plots a green line below price.
- If price closes below, it switches to bearish and plots a red line above price.
This means each point on the Supertrend reflects both price direction and volatility. Higher ATR values (volatile markets) widen the bands, while low ATR values (quiet markets) bring them closer to price.
How to Read the Indicator
Supertrend is straightforward to interpret:
- Buy signal: Price closes above the line, Supertrend turns green and moves below price.
- Sell signal: Price closes below the line, Supertrend turns red and moves above price.
- As long as the line remains green, the trend is considered up; as long as it is red, the trend is down.
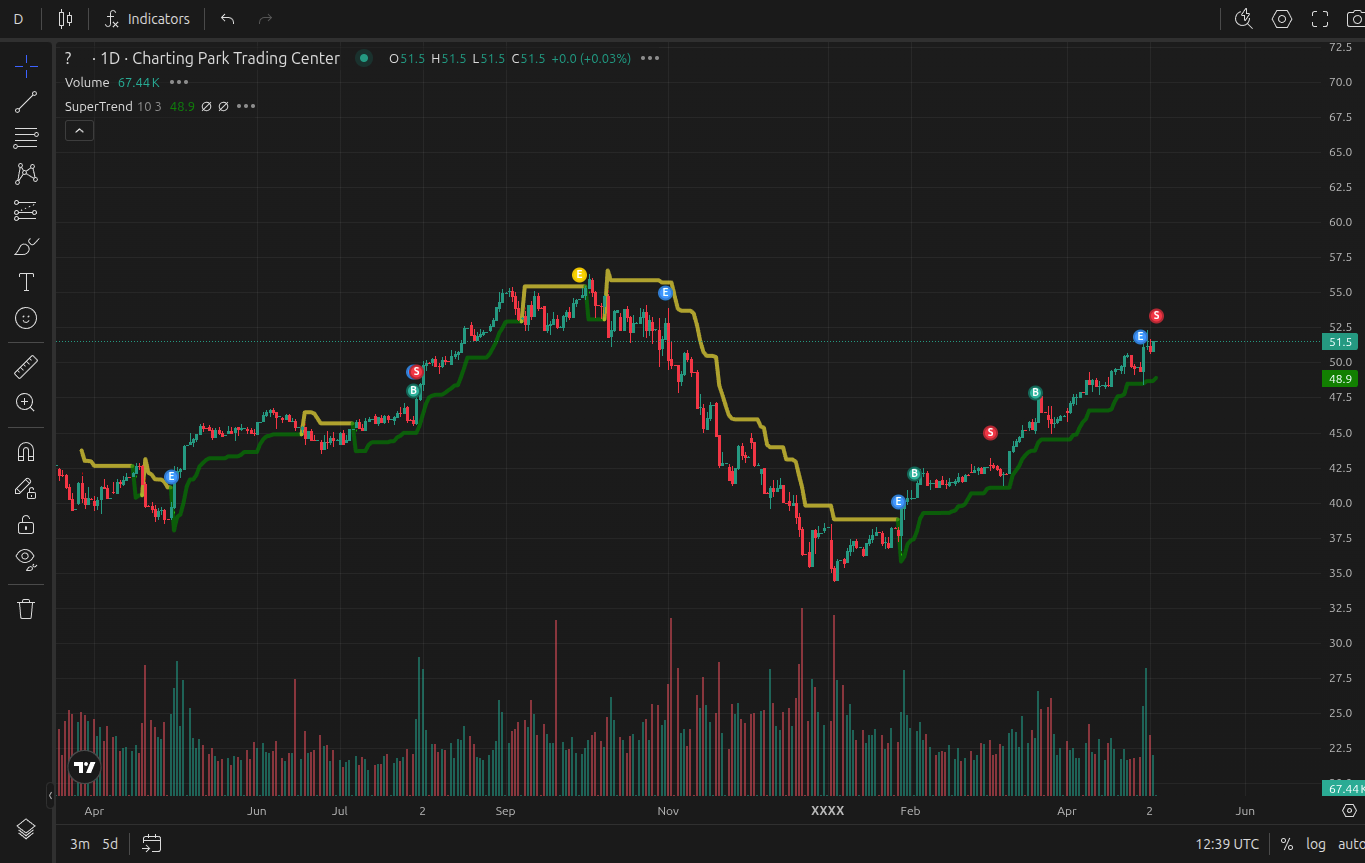
Example of Supertrend displayed on a TradingView chart
Common Trading Strategies with Supertrend
Here are practical ways traders apply Supertrend:
- Trend following: Enter long when Supertrend flips green, and stay in the trade until it flips red.
- ATR multiplier settings: Commonly set to 3, but aggressive traders may use 1.5–2 for earlier entries, while conservative traders may use 4–5 for stronger confirmation.
- Combination with moving averages: Some traders confirm a Supertrend signal with a moving average crossover (e.g., 50 EMA above 200 EMA).
- Filter with RSI: Enter trades only if RSI confirms momentum, reducing false signals during choppy markets.
Strengths and Limitations
- Strengths: Easy-to-read visual signals, works well in trending markets, adapts to volatility via ATR.
- Limitations: Generates whipsaws in sideways markets, lagging indicator (reacts after the move starts), sensitive to parameter settings.
Because of its simplicity, many traders rely on Supertrend as a base indicator but combine it with others for confirmation.
Practicing with the Indicator
To master Supertrend, traders need repeated practice in different market conditions. A trading simulator like ChartingPark allows users to fast-forward through historical charts, apply Supertrend, and test different ATR settings. This kind of structured practice is more effective than passive observation.
Conclusion
The Supertrend indicator is a simple yet powerful tool for identifying trend direction and potential trade setups. While it works best in trending conditions, traders should be aware of false signals in ranging markets. Practicing with it in a trading simulator helps refine execution and discipline.