Average True Range (ATR) Simply Explained
Learn how the Average True Range (ATR) indicator measures market volatility, how to read it, and practical ways to use it in trading.
Introduction
The Average True Range (ATR) is a volatility indicator developed by J. Welles Wilder. Unlike trend or momentum indicators, ATR does not show direction; instead, it measures how much an asset typically moves during a given period. Traders use it to gauge market volatility and adjust position sizing, stop losses, or strategy expectations accordingly.
How the Indicator Works
ATR is based on the concept of True Range (TR). For each period (such as a day or a candle), the true range is defined as the largest of:
- Current high – current low
- Absolute value of current high – previous close
- Absolute value of current low – previous close
The ATR is then calculated as a moving average (commonly 14 periods) of these true ranges. The result is a smooth line that expands during high volatility and contracts when price movement is quieter.
Example: If a stock has a daily ATR of 2.5, it means that, on average, the stock moves 2.5 points (up or down) per day.
How to Read the Indicator
ATR is plotted as a line beneath the main chart:
- A rising ATR suggests increasing volatility — the market is moving more dramatically.
- A falling ATR suggests decreasing volatility — price action is calmer.
- The actual ATR value indicates the expected average price move over the chosen period.
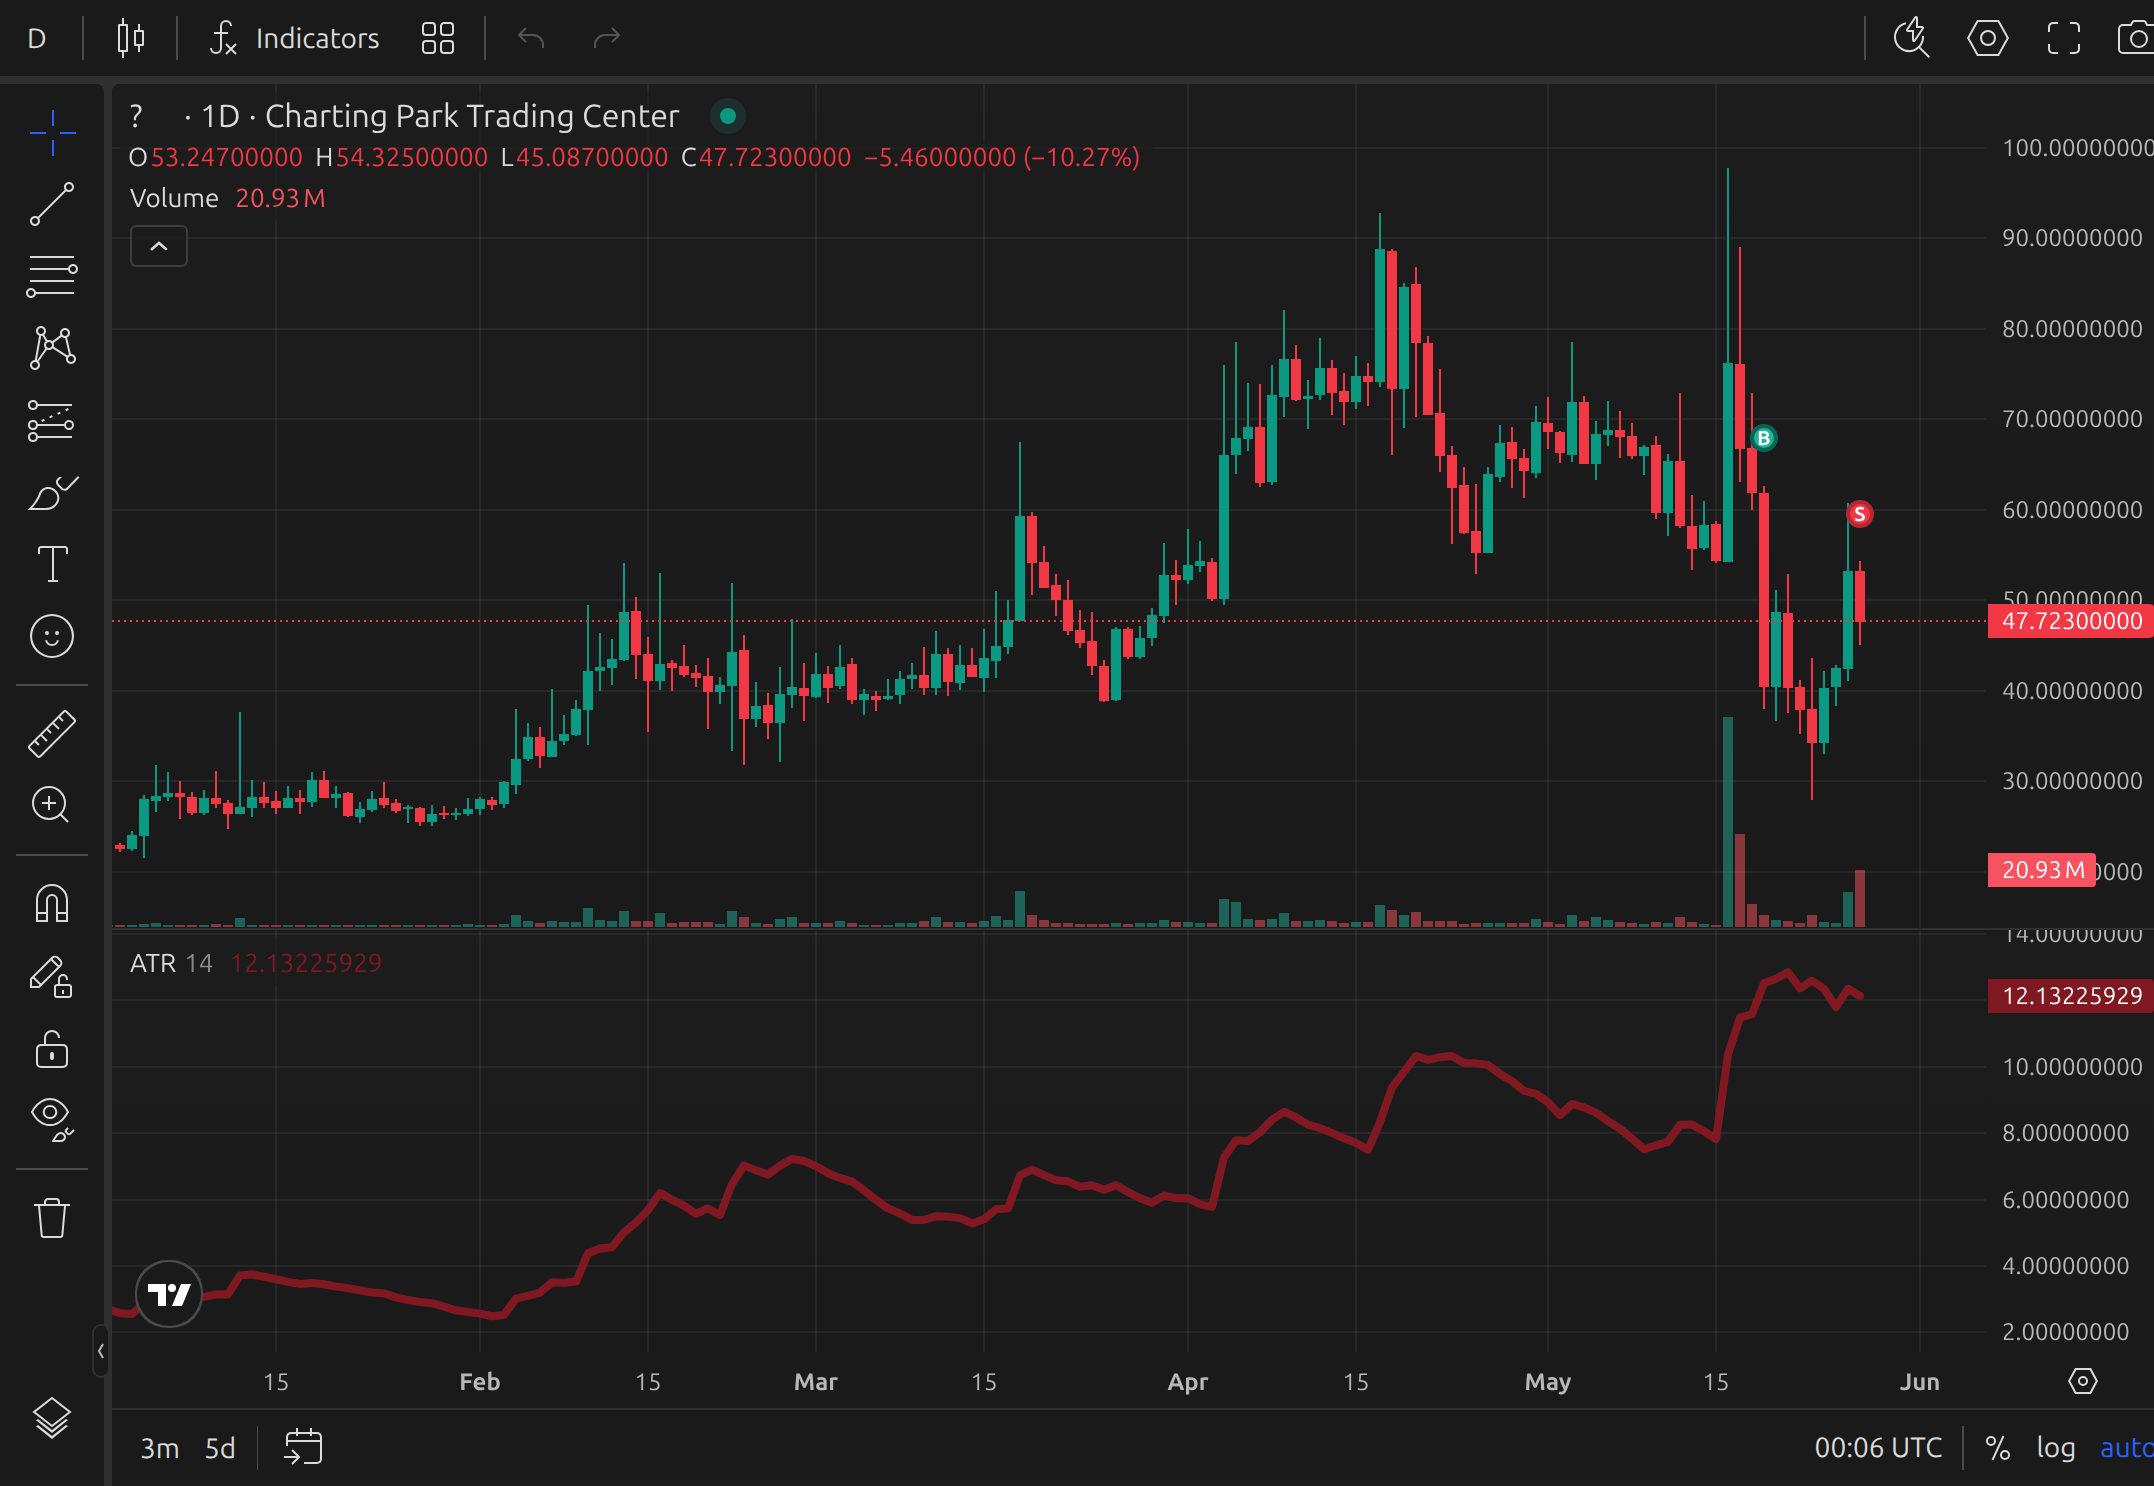
Example of ATR displayed on a TradingView chart
Common Trading Strategies with ATR
Here are a few practical ways traders use ATR:
- Stop Loss Placement: Traders often set stop losses at a multiple of the ATR (e.g., 1.5× ATR below entry for longs) to account for normal volatility.
- Position Sizing: A higher ATR indicates greater volatility, so traders may reduce position size to keep risk consistent.
- Breakout Confirmation: If ATR is rising during a breakout, it suggests stronger momentum compared to a breakout with low ATR.
Different settings (e.g., ATR(14) vs. ATR(21)) make the indicator more or less sensitive. Shorter ATRs react faster but can be noisier, while longer ATRs provide smoother, slower signals.
Strengths and Limitations
- Strengths: ATR is excellent for measuring volatility and adjusting risk management. It adapts to changing market conditions.
- Limitations: ATR does not indicate price direction. High volatility can occur in both uptrends and downtrends, so traders should combine it with trend or momentum indicators.
Practicing with the Indicator
To effectively use ATR, traders should practice observing how volatility shifts across different assets and timeframes. The best way to do this is through a trading simulator like ChartingPark, where you can fast-forward through historical charts, apply the ATR indicator, and test stop-loss placement or position sizing strategies in real time.