Accumulation/Distribution (ADL) Simply Explained
Learn how the Accumulation/Distribution Line (ADL) helps traders track buying and selling pressure by combining price and volume into a cumulative indicator.
Introduction
The Accumulation/Distribution Line (ADL) is a volume-based technical indicator that helps traders assess whether money is flowing into or out of a security. By combining price and volume, it provides insights into the underlying buying and selling pressure that may not be visible from price action alone. Traders often use the ADL to confirm trends or spot divergences between price and volume.
How the Indicator Works
The ADL is built from two components:
- Money Flow Multiplier (MFM): Shows where the closing price lies within the day’s high-low range. A close near the high gives a positive value, while a close near the low gives a negative value.
- Money Flow Volume (MFV): MFM multiplied by volume, reflecting the strength of buying or selling pressure.
The ADL is a cumulative total of MFV values over time. If the ADL rises, it indicates accumulation (buying pressure). If it falls, it suggests distribution (selling pressure).
How to Read the Indicator
Key interpretations of the ADL include:
- Trend Confirmation: If both price and ADL move upward, the trend is supported by buying pressure.
- Divergences: If price rises but the ADL falls, it may signal weakening demand or hidden distribution.
- Breakout Signals: A breakout in price supported by an ADL breakout increases reliability.
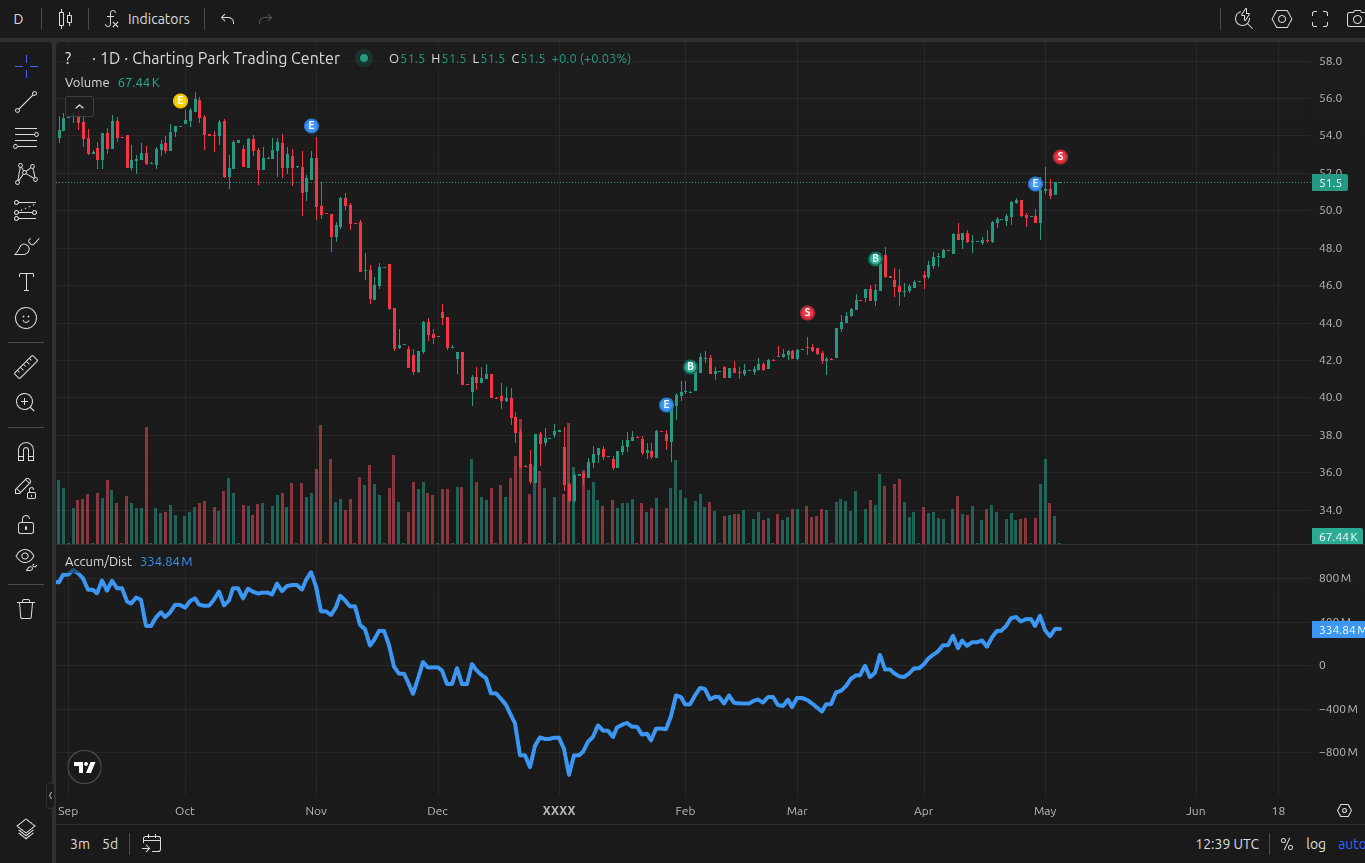
Example of ADL displayed on a TradingView chart
Common Trading Strategies with ADL
Traders apply the ADL in several practical ways:
- Trend Following: Use ADL direction to confirm price trends. A rising ADL supports long positions, while a falling ADL supports shorts.
- Divergence Trading: Watch for ADL divergences with price to anticipate reversals. For example, if price makes higher highs but ADL makes lower highs, selling pressure may be increasing.
- Combination with Other Indicators: Many traders combine ADL with momentum tools like the RSI or moving averages to confirm signals.
Strengths and Limitations
Strengths:
- Incorporates both price and volume, giving deeper insight into market dynamics.
- Helps detect hidden buying or selling pressure not visible in price action alone.
- Useful for confirming breakouts and identifying divergences.
Limitations:
- Can generate false signals in low-volume environments.
- Does not provide exact entry or exit levels—better suited for confirmation.
- Should not be used in isolation; combining with other indicators improves reliability.
Practicing with the Indicator
Understanding ADL signals requires practice in real chart conditions. A trading simulator like ChartingPark allows traders to fast-forward through historical markets, apply the ADL, and test its effectiveness without risking capital. By replaying sessions, you can observe how ADL divergences and confirmations play out in different environments.