VWAP (Volume Weighted Average Price) Simply Explained
Learn how the VWAP indicator works, how to read it on charts, and how traders use it for practice trading and strategy building.
Introduction
The Volume Weighted Average Price (VWAP) is a technical indicator that shows the average price of a security, adjusted for trading volume, over a specific time period. Unlike a simple moving average, VWAP places more weight on periods with higher trading volume. Traders use VWAP to identify fair value levels, intraday support and resistance, and to gauge whether the market is trading at a premium or discount relative to volume-weighted levels.
How the VWAP Works
VWAP is calculated by taking the cumulative total of (Price × Volume) divided by the cumulative total of Volume over a set time period (usually intraday).
- Price × Volume: This gives the total value traded at each price level.
- Cumulative totals: The sum of these values is divided by total volume traded so far in the session.
- Reset: VWAP typically resets at the start of each new trading session.
For example, if a stock trades 1,000 shares at $100 and later 500 shares at $105, the VWAP after those trades would be (100,000 + 52,500) / 1,500 = $101.67.
How to Read VWAP
VWAP is plotted as a line on the price chart. It acts as a benchmark for intraday price action:
- Price above VWAP: Indicates bullish sentiment; buyers are willing to pay above average.
- Price below VWAP: Indicates bearish sentiment; sellers dominate, pushing prices below average.
- VWAP line itself: Acts as dynamic support or resistance throughout the day.
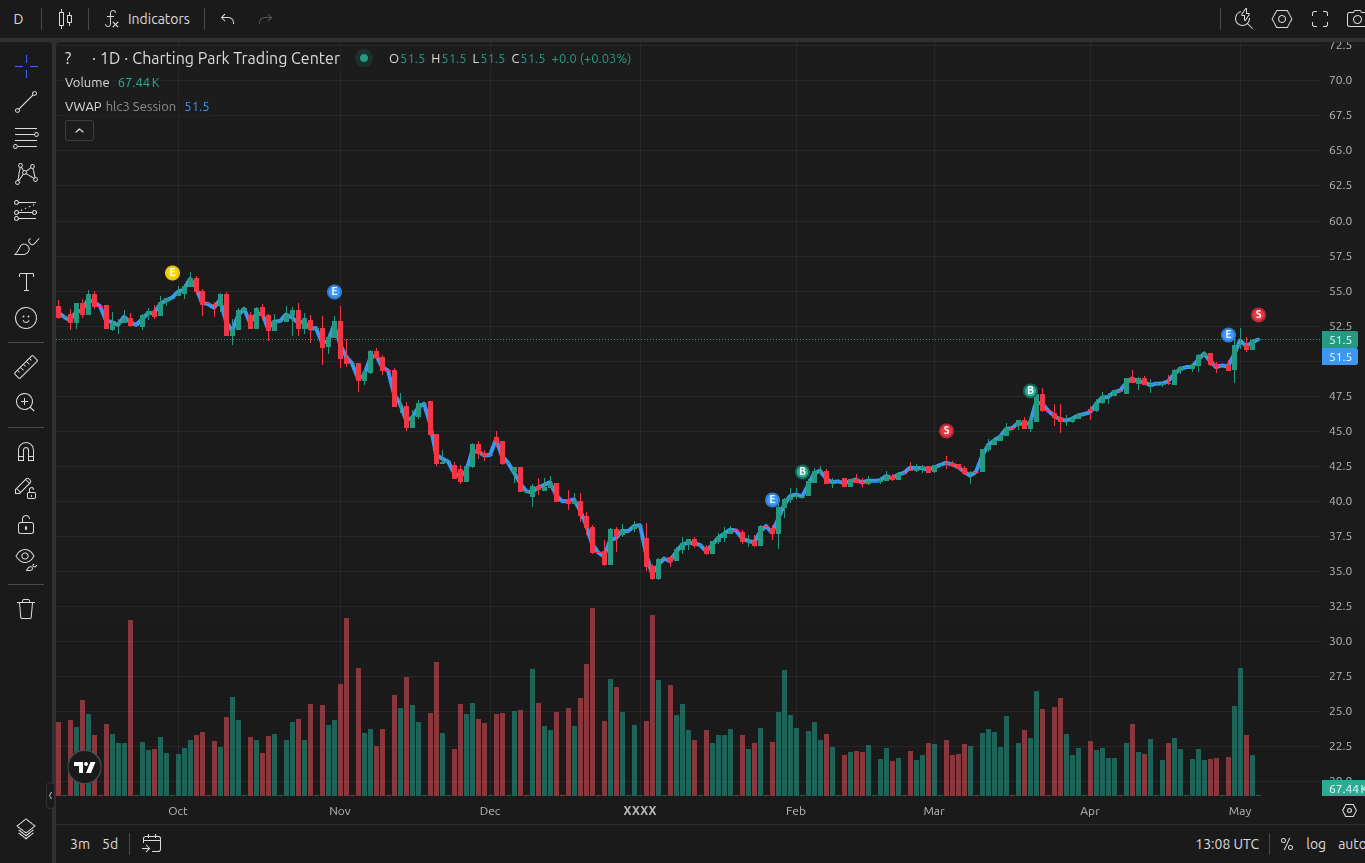
Example of VWAP displayed on a TradingView chart
Common Trading Strategies with VWAP
- Trend Confirmation: Enter long trades when price is consistently above VWAP, and short trades when below.
- Mean Reversion: Fade moves far from VWAP by anticipating a return toward it.
- VWAP Cross: Look for buy signals when price crosses above VWAP, or sell signals when it crosses below.
Many traders also use VWAP alongside other indicators like moving averages or RSI to confirm trade direction and avoid false signals.
Strengths and Limitations
Strengths:
- Adjusts for volume, making it more reliable than simple averages for intraday trading.
- Provides a clear benchmark for institutional and retail traders alike.
- Helps identify intraday support and resistance.
Limitations:
- Primarily designed for intraday use; less useful for multi-day analysis.
- Can lag rapidly moving prices, similar to other moving averages.
- False signals may occur when used alone, especially in choppy markets.
Practicing with VWAP
To get the most from VWAP, traders need to practice reading it in different market conditions. A trading game like ChartingPark lets you fast-forward through real historical price action, applying VWAP in both bullish and bearish environments. This helps you learn how VWAP interacts with price in real time.
Inside ChartingPark, you can combine VWAP practice with drills or rated sessions to measure consistency. Session reports highlight metrics such as expectancy, win rate, and drawdown, helping you understand whether VWAP strategies improve your edge.
Conclusion
VWAP is a widely used technical indicator that balances price with volume, offering traders a fair-value benchmark throughout the trading session. While powerful for intraday strategies, it works best when combined with other forms of analysis and practiced in simulated environments.