Stochastic Oscillator Simply Explained
Learn how the Stochastic Oscillator works, how to read its signals, and how to practice using it effectively in a trading simulator.
Introduction
The Stochastic Oscillator is a momentum indicator that compares a security’s closing price to its price range over a specific period. Traders use it to identify potential trend reversals, overbought and oversold conditions, and momentum shifts. Its popularity comes from its simplicity and ability to provide early signals of price movement.
How the Indicator Works
The Stochastic Oscillator calculates two lines:
- %K: The main line showing the current close relative to the chosen lookback period (commonly 14 periods).
- %D: A smoothed moving average of %K, often calculated over 3 periods.
Formula for %K:
%K = (Current Close – Lowest Low) / (Highest High – Lowest Low) × 100
This normalizes the current price on a scale from 0 to 100, where 0 means the close is the lowest in the lookback period and 100 means it’s the highest.
How to Read the Indicator
Key interpretations include:
- Overbought: When %K is above 80, the asset may be overbought and due for a pullback.
- Oversold: When %K is below 20, the asset may be oversold and due for a bounce.
- Crossovers: A bullish signal occurs when %K crosses above %D. A bearish signal occurs when %K crosses below %D.
- Divergence: When price makes a new high or low but the oscillator does not, it may signal weakening momentum.
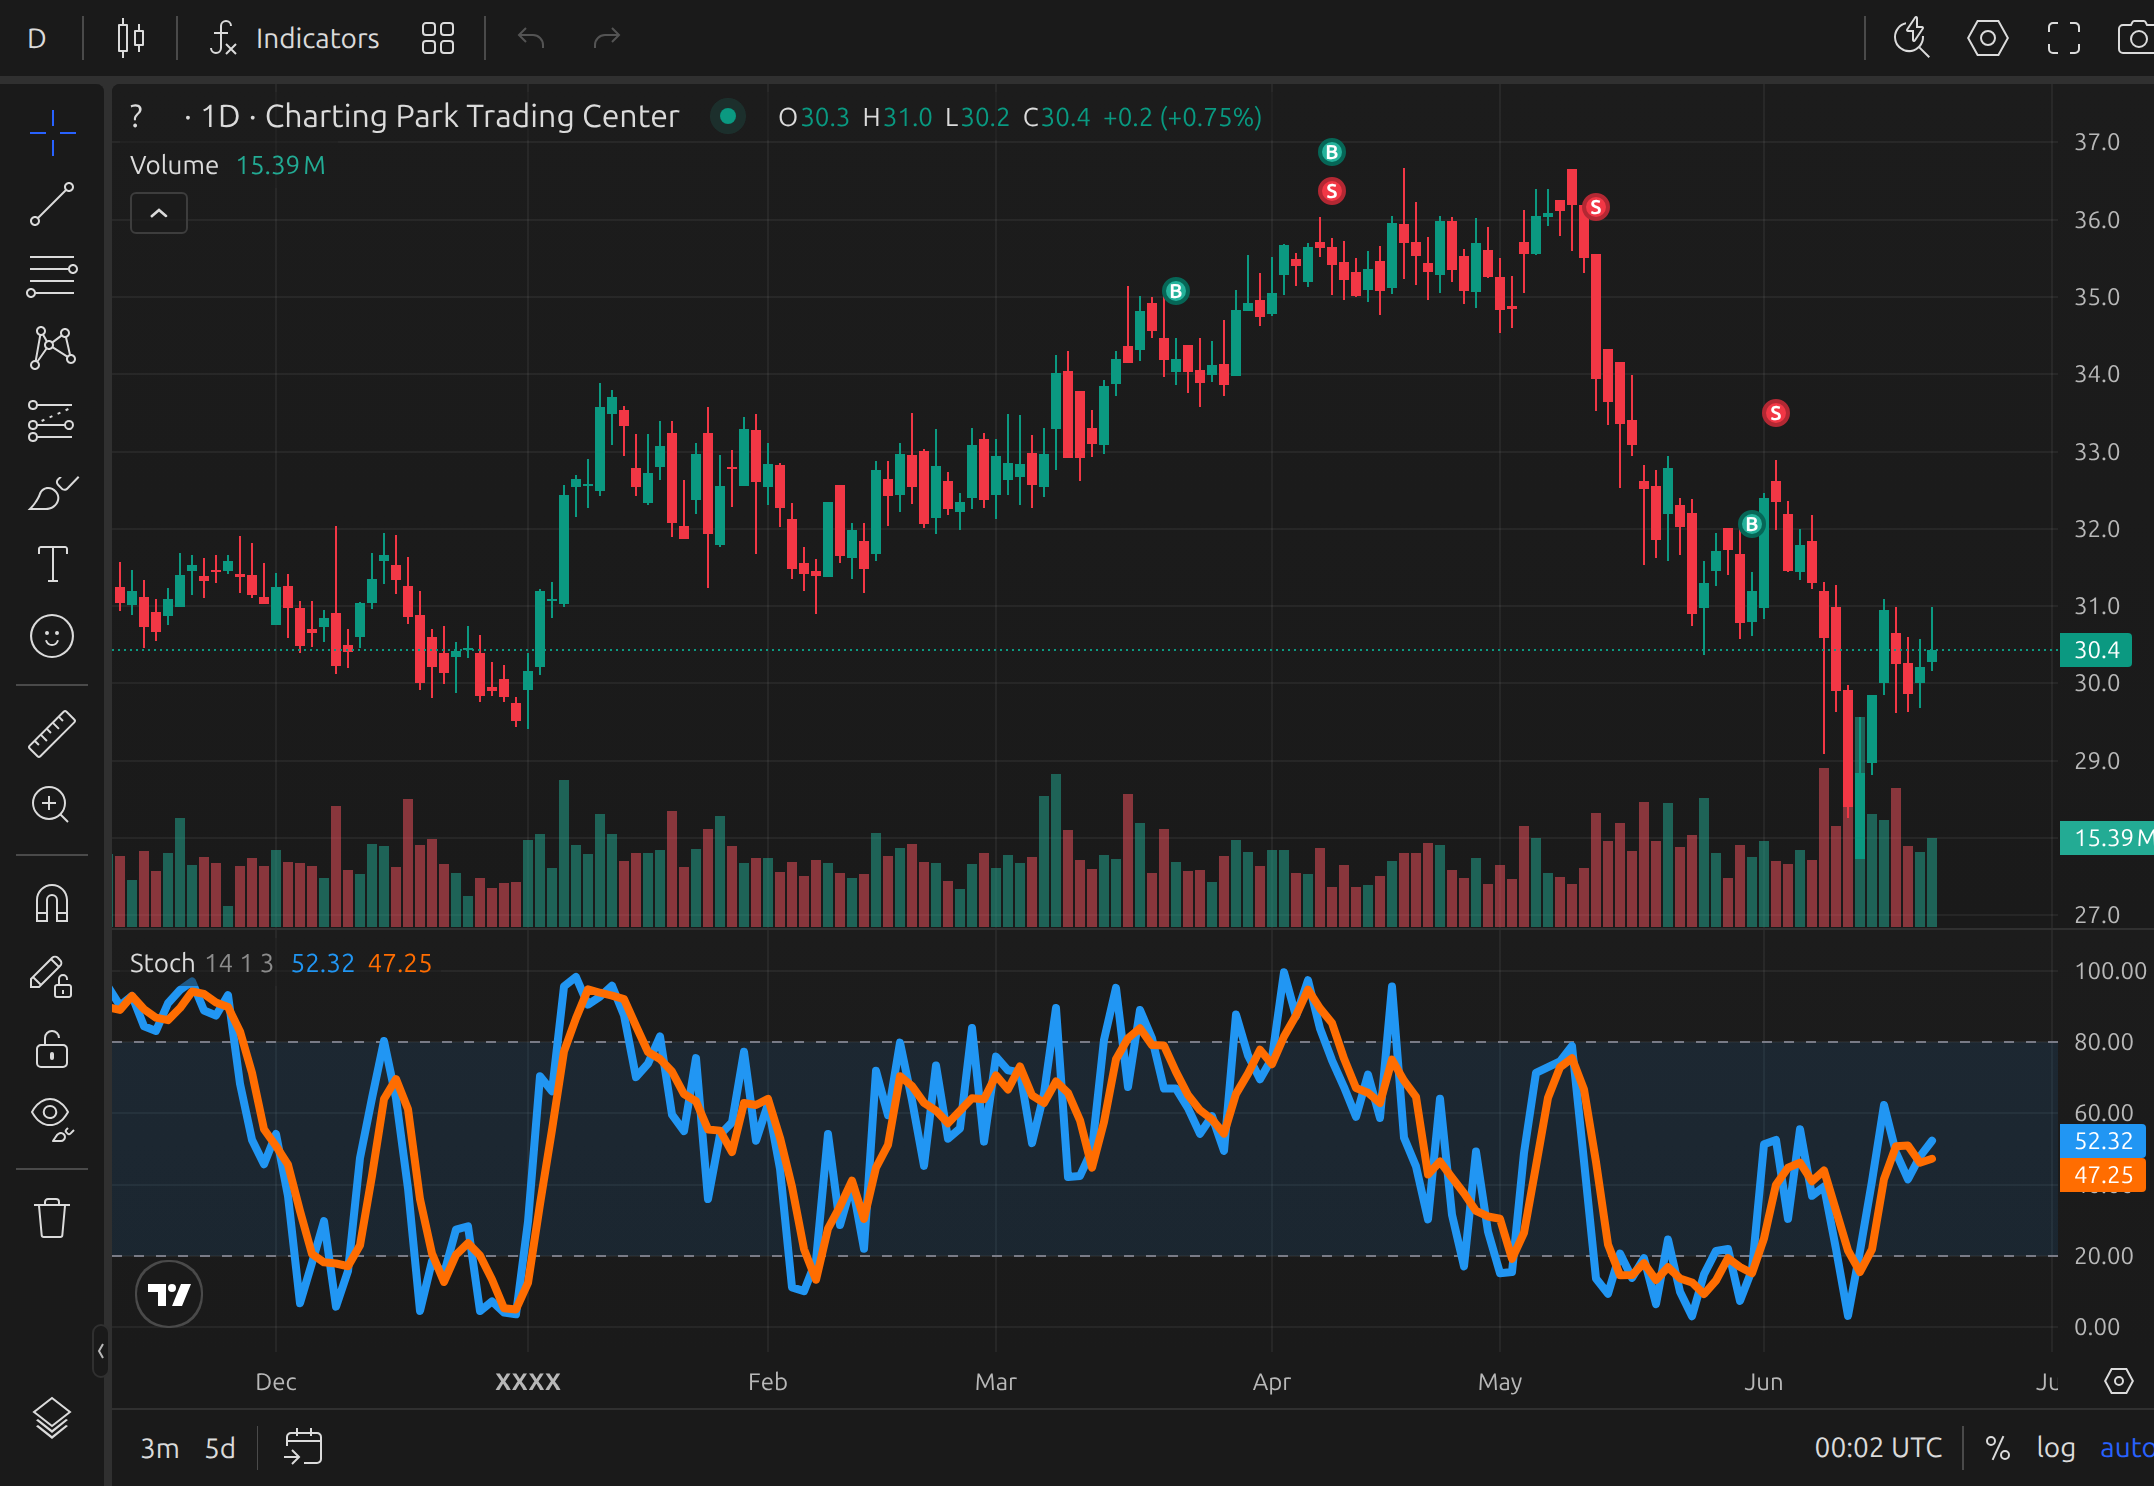
Example of Stochastic Oscillator displayed on a TradingView chart
Common Trading Strategies with Stochastic Oscillator
- Overbought/Oversold Trading: Sell when the oscillator is above 80 and turns down, buy when it is below 20 and turns up.
- Crossover Strategy: Buy when %K crosses above %D in oversold territory, sell when %K crosses below %D in overbought territory.
- Divergence Confirmation: Combine divergences with price action or other indicators like RSI or Moving Averages for stronger signals.
Traders often adjust the settings (e.g., 5, 14, or 21 periods) depending on whether they want faster but noisier signals or slower but smoother ones.
Strengths and Limitations
Strengths:
- Helps identify momentum shifts early.
- Effective in range-bound markets.
- Combines well with trend-following indicators.
Limitations:
- Generates false signals in strong trends (price can stay overbought/oversold for long periods).
- Lagging nature when smoothed with moving averages.
- Should not be used in isolation without confirmation.
Practicing with the Indicator
Understanding the Stochastic Oscillator requires practice in different market conditions. Using a trading simulator like ChartingPark, traders can fast-forward through historical data to observe how the oscillator behaves during trends, ranges, and reversals. This hands-on approach helps build confidence in recognizing high-probability setups.
For deeper learning, see related guides: MACD Explained