Chaikin Money Flow (CMF) Simply Explained
What CMF measures, how to read zero-line shifts and divergences, plus practical strategies and drills in a trading simulator.
Introduction
Chaikin Money Flow (CMF) is a volume-weighted oscillator that gauges buying and selling pressure over a lookback window (commonly 20 or 21 periods). By blending price location within each bar’s range with volume, CMF helps traders assess whether a market is under accumulation (demand) or distribution (supply). For technical traders and anyone practicing price action, it’s a practical way to confirm trends, filter breakouts, and spot weakening momentum.
How the Indicator Works
CMF is built from three parts:
- Money Flow Multiplier (MFM):
((Close − Low) − (High − Close)) / (High − Low). IfHigh = Low, set MFM to0to avoid division by zero. - Money Flow Volume (MFV):
MFM × Volume. - Chaikin Money Flow:
Sum(MFV, N) / Sum(Volume, N), whereNis the lookback (e.g., 20 or 21).
Intuition: when closes cluster near the high on strong volume, MFV skews positive; near the low on strong volume, MFV skews negative. CMF aggregates this balance across the last N bars, returning values roughly between -1 and +1.
Plain-number example: suppose over 3 bars the MFV sums to +2.4M shares and total volume sums to 6.0M shares. Then CMF = 2.4 / 6.0 = +0.40, indicating strong accumulation during that window.
How to Read the Indicator
- Above zero: net accumulation; buyers control recent flow.
- Below zero: net distribution; sellers dominate recent flow.
- Zero-line flips: a shift from negative → positive (or vice versa) can precede momentum turns.
- Magnitude / thresholds: many traders apply a buffer (e.g.,
±0.05to±0.10) to reduce whipsaws. Values beyond±0.25often coincide with strong trends. - Divergences: if price makes a new high but CMF fails to confirm (lower high or stays negative), buying pressure may be fading; the reverse for new price lows.
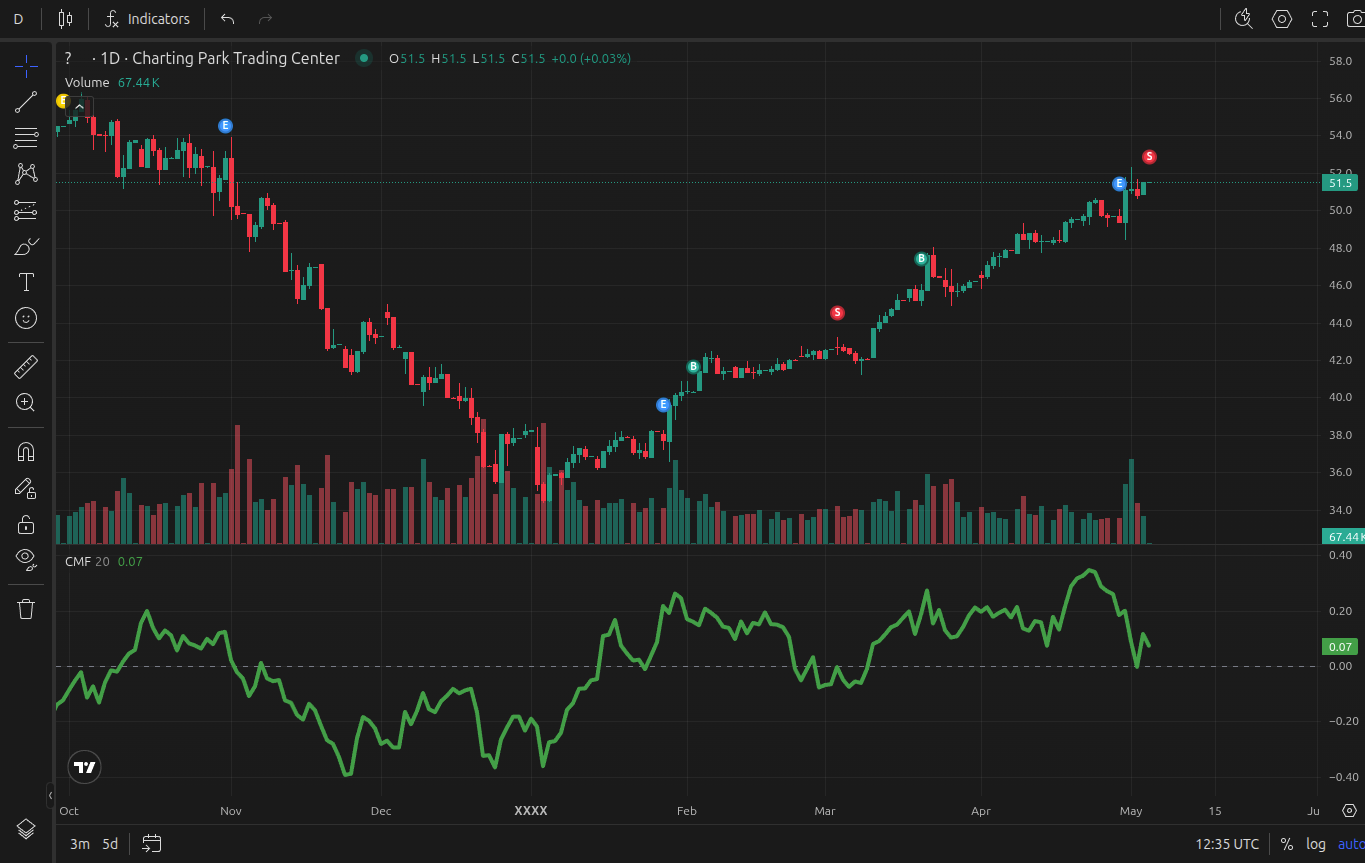
Example of Chaikin Money Flow (CMF) displayed on a TradingView chart
Common Trading Strategies with CMF
Here are practical, simulator-friendly approaches. Adjust settings based on your asset and timeframe.
1) Zero-Line Crossover with Buffer
- Setup: CMF length 20–21; confirm cross through
+0.05(bullish) or−0.05(bearish) to filter noise. - Entry: Long when CMF crosses above the positive buffer and price is above a rising 20–50 EMA; short on the opposite.
- Stops: Use recent swing low/high or ATR-based stops (e.g.,
1.5–2.0 × ATR(14)). - Management: Consider partial profits at
1Rand trail behind structure or a moving average.
2) Breakout Confirmation
- Setup: Identify horizontal breakouts on price (range highs/lows).
- Filter: Only trade breakouts when CMF is already positive (for upside) or negative (for downside), preferably beyond
±0.10. - Entry: Enter on retest/acceptance of the breakout level.
- Stops: Invalidate below/above the broken level or use ATR.
3) Divergence + Structure
- Setup: Spot price making higher highs while CMF prints lower highs (bearish divergence), or lower lows with higher lows on CMF (bullish divergence).
- Trigger: Wait for price confirmation (trendline break, lower high/higher low) rather than trading divergence alone.
- Context: Best near prior supply/demand or when higher-timeframe trend looks tired.
Parameter notes: shorter CMF (10–14) is more reactive but noisy; longer (30–40) is calmer but lags. Stocks often prefer 20–21. Crypto may need slightly longer to smooth weekend/overnight effects.
Strengths and Limitations
- Strengths
- Combines price location with volume — a richer view than price-only oscillators.
- Useful as a context filter: trade in the direction of positive/negative flow.
- Helps validate breakouts and trend strength.
- Limitations
- Range-bound markets can generate frequent whipsaws around zero.
- Illiquid issues or sudden gap days can distort readings.
- Not a standalone system — pair with structure, trend, and risk management.
Practicing with the Indicator
The fastest way to internalize CMF is to practice with accelerated historical charts. In the ChartingPark trading simulator (a trading game for technical traders), you can:
- Fast-forward price action to see how CMF evolves around breakouts, pullbacks, and reversals.
- Run Rated sessions where SL/TP are required and your execution affects a rating and seasonal leaderboard.
- Use Drills to iterate on one setup (e.g., only zero-line flips with buffer).
- Review metrics such as Win Rate, Avg. R:R, Expectancy, Cumulative Return, and Max Drawdown to measure edge quality.
Suggested CMF Practice Drills
- Zero-Line Flip Drill: Trade only when CMF crosses ±0.05 and price aligns with the 20/50 EMA trend. Journal whether the buffer reduced false starts.
- Breakout + CMF Filter: Take only breakouts with confirming CMF. Track hit-rate vs. breakouts without confirmation.
- Divergence at Levels: Mark prior S/R, then trade only when CMF divergence coincides at those levels with price confirmation.
Conclusion
CMF brings volume context to price action, helping you distinguish genuine demand from weak breakouts and exhausting trends. Use zero-line shifts, breakouts with confirmation, and divergences with structure and risk rules. Then validate your approach in a simulator to build confidence and consistency.