Bollinger Bands Simply Explained
An intuitive guide to Bollinger Bands — how they work, how traders read them, and ways to practice using them
Introduction
Bollinger Bands are a popular technical analysis indicator developed by John Bollinger. They help traders measure volatility and identify potential overbought or oversold conditions. By plotting dynamic price bands around a moving average, Bollinger Bands expand when markets become volatile and contract when volatility decreases. This makes them especially useful for traders looking to time entries and exits based on changing market conditions.
How Bollinger Bands Work
Bollinger Bands consist of three main components:
- Middle Band: A simple moving average (SMA), typically set to 20 periods.
- Upper Band: Middle band + (2 × standard deviation).
- Lower Band: Middle band – (2 × standard deviation).
The use of standard deviation means the bands automatically adjust to market volatility. If prices are stable, the bands narrow. If markets move sharply, the bands widen. For example, if the 20-day SMA of a stock is $100 and the standard deviation is $5, the upper band would be $110 and the lower band $90.
How to Read the Indicator
Traders typically interpret Bollinger Bands in the following ways:
- Overbought and Oversold Signals: When price touches the upper band, it may indicate overbought conditions. When price touches the lower band, it may signal oversold conditions.
- Bollinger Squeeze: Narrowing bands suggest low volatility and often precede significant price breakouts.
- Breakouts: A strong price move outside the bands can indicate trend continuation, though false signals are common.
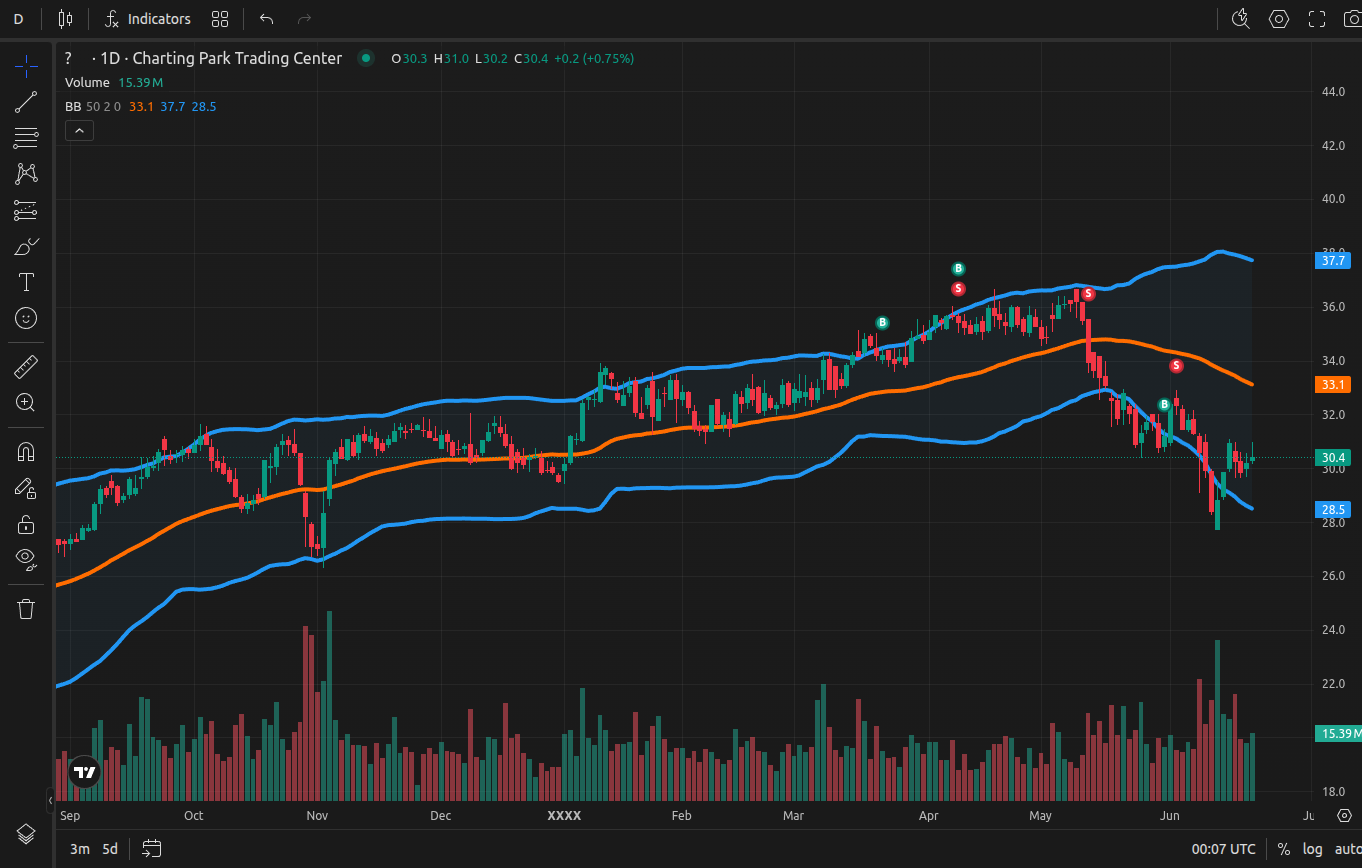
Example of Bollinger Bands displayed on a TradingView chart
Common Trading Strategies with Bollinger Bands
- Reversal Trades: Traders look for price to touch an outer band and then reverse back toward the middle SMA. This works best in ranging markets.
- Breakout Trades: During a Bollinger Squeeze, traders watch for a breakout above or below the bands to signal a new trend forming.
- Band Riding: In strong trends, price may “ride the band,” touching the upper band multiple times in an uptrend or the lower band in a downtrend.
Settings can be adjusted. For example, using a 10-period SMA instead of 20 makes the bands more sensitive, providing more frequent signals but also more noise.
Strengths and Limitations
Strengths:
- Adapts automatically to volatility changes.
- Useful for identifying potential reversals and breakouts.
- Easy to combine with other indicators such as RSI or MACD.
Limitations:
- Not a standalone indicator — needs confirmation from price action or other tools.
- False breakouts are common when price moves briefly outside the bands.
- Best suited for short to medium-term analysis, less reliable on very long timeframes.
Practicing with Bollinger Bands
To truly understand Bollinger Bands, traders need to practice reading them in real chart conditions. A trading game like ChartingPark allows you to fast-forward through historical markets, apply Bollinger Bands, and test how well you can spot reversals, breakouts, and squeezes. Instead of waiting days for setups to play out, you can experience weeks of activity in minutes. This is ideal for improving timing and execution.