Awesome Oscillator (AO) Simply Explained
Learn how the Awesome Oscillator (AO) helps traders spot momentum shifts and trend confirmations using a simple histogram approach.
Introduction
The Awesome Oscillator (AO), developed by Bill Williams, is a momentum indicator that helps traders measure market strength. It compares recent market momentum to a longer period, showing whether bulls or bears are currently in control. The AO is particularly useful for spotting trend reversals, confirming directions, and identifying potential entry points.
How the Awesome Oscillator Works
The AO is calculated as the difference between a short-term and long-term moving average of the median price:
- Median Price = (High + Low) / 2
- 5-period SMA of the median price
- 34-period SMA of the median price
- AO Value = 5 SMA – 34 SMA
The result is displayed as a histogram above or below the zero line. Green bars indicate momentum increasing compared to the previous bar, while red bars indicate momentum decreasing.
How to Read the Awesome Oscillator
Traders interpret the AO primarily through its histogram patterns:
- Zero Line Crossover: When AO moves above zero, it suggests bullish momentum; when below zero, bearish momentum.
- Twin Peaks: A bullish setup occurs when there are two rising valleys below zero. A bearish setup occurs with two falling peaks above zero.
- Saucer Setup: A reversal signal forms when histogram bars change direction quickly (e.g., two red bars followed by a green bar above zero).
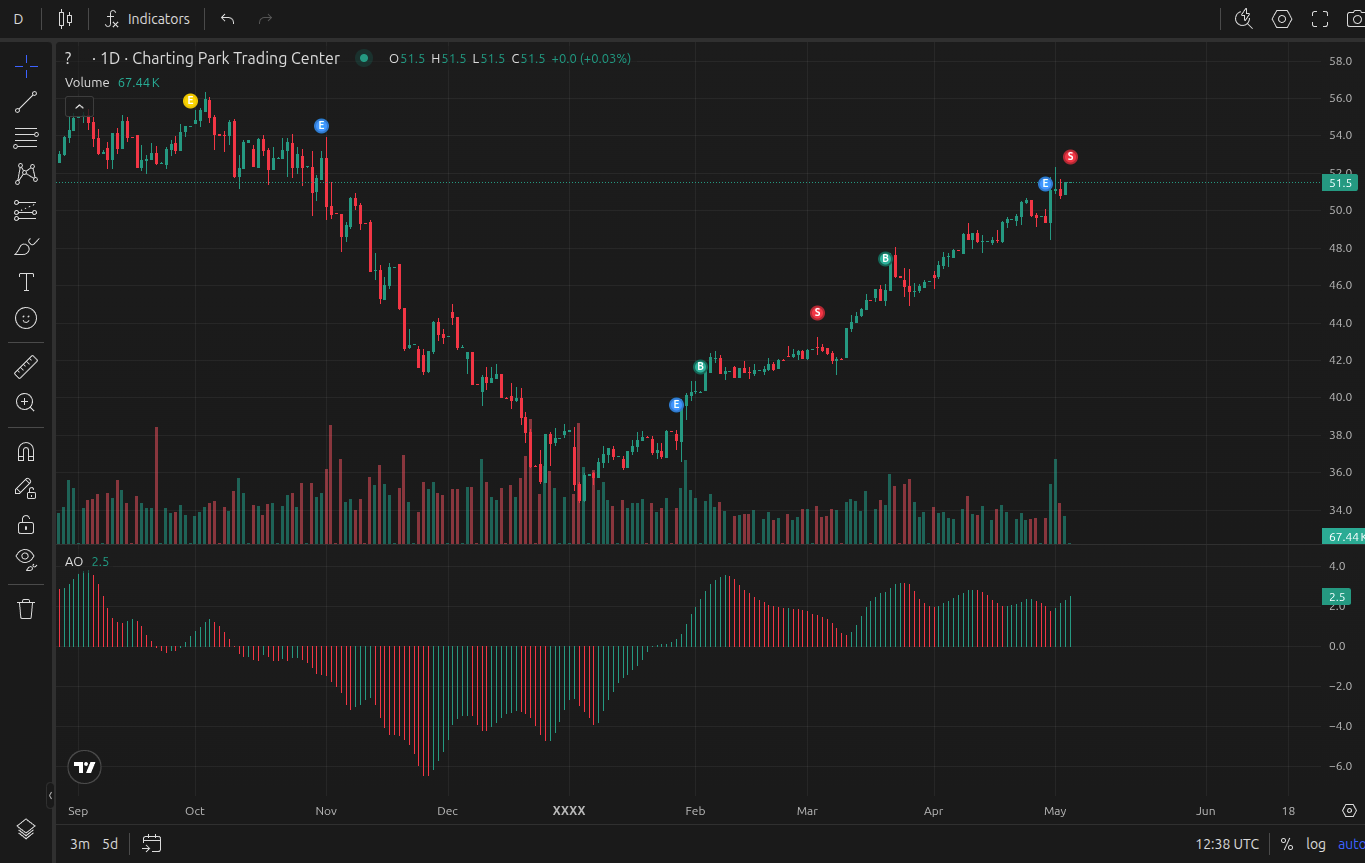
Example of the Awesome Oscillator (AO) displayed on a TradingView chart
Common Trading Strategies with AO
Here are practical ways traders use the AO:
- Trend Confirmation: Use AO crossovers with moving averages to confirm momentum before entering trades.
- Divergence Trading: Spot divergence between price action and AO histogram to anticipate reversals.
- Combining Indicators: Many traders combine AO with moving averages or RSI for confirmation.
Settings are typically kept at 5 and 34 periods, but traders may adjust them depending on timeframe or instrument volatility.
Strengths and Limitations
- Strengths: Simple visual design, effective at spotting momentum shifts, useful for confirming breakouts.
- Limitations: Can generate false signals in ranging markets; should not be used as a standalone tool.
Practicing with the Awesome Oscillator
Indicators like AO are best understood through practice. Using a trading simulator such as ChartingPark lets traders fast-forward through historical price action, apply AO, and test strategies without risk. You can replay market sessions, spot AO crossovers, and confirm setups in both price action and indicator-based trading.
Conclusion
The Awesome Oscillator is a straightforward yet powerful tool for identifying momentum and trend direction. By learning its core signals—zero line crossovers, twin peaks, and saucer setups—traders can integrate AO into broader trading systems. Remember to use it alongside other analysis methods and practice extensively.