Aroon Indicator Simply Explained
Understand how the Aroon Indicator works, how to interpret its signals, and how traders can practice using it inside a trading simulator.
Introduction
The Aroon Indicator is a technical analysis tool developed by Tushar Chande in 1995. Its purpose is to identify whether a market is trending and to measure the strength of that trend. Unlike moving averages, which lag price, the Aroon Indicator looks at the timing of recent highs and lows to determine trend direction. This makes it particularly useful for spotting trend changes early.
How the Aroon Indicator Works
The Aroon Indicator is composed of two lines:
- Aroon Up: Measures how long it has been since the last high within a lookback period.
- Aroon Down: Measures how long it has been since the last low within the same lookback period.
Both values are expressed as percentages between 0 and 100. A standard setting uses a 25-period lookback. For example, if the highest high in the last 25 periods occurred today, Aroon Up will read 100. If it occurred 10 periods ago, Aroon Up will be ((25-10)/25) × 100 = 60.
How to Read the Aroon Indicator
Traders typically interpret the indicator using the following guidelines:
- Aroon Up above 70 and Aroon Down below 30: Suggests a strong uptrend.
- Aroon Down above 70 and Aroon Up below 30: Suggests a strong downtrend.
- Crossovers: When Aroon Up crosses above Aroon Down, it may signal a bullish trend reversal; the opposite crossover suggests bearish reversal.
- Flat readings near 50 indicate lack of a strong trend (range-bound market).
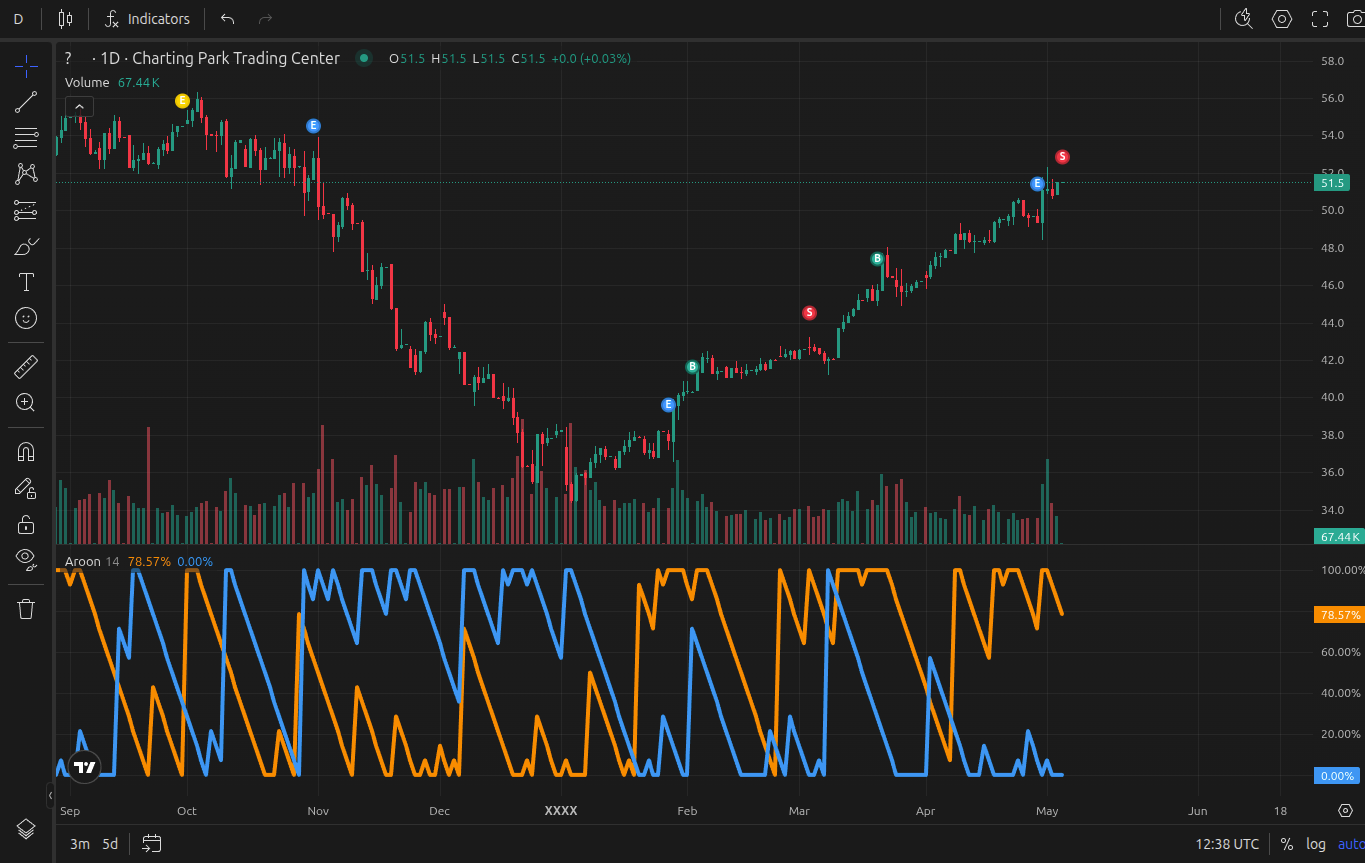
Example of Aroon Indicator displayed on a TradingView chart
Common Trading Strategies with Aroon
Here are some practical ways traders apply the Aroon Indicator:
- Trend Confirmation: Use Aroon crossovers to confirm breakouts seen on price action.
- Range vs Trend Filter: Avoid trend-following strategies when both Aroon lines hover around 50, as this signals consolidation.
- Combination with Other Indicators: Traders often pair Aroon with oscillators like RSI to avoid false breakouts. For example, if Aroon Up crosses above Aroon Down while RSI is above 50, the bullish signal is stronger.
Changing the lookback period alters sensitivity: shorter settings (e.g., 14) react faster but give more false signals; longer settings (e.g., 50) reduce noise but may delay entries.
Strengths and Limitations
Strengths:
- Quickly identifies trend direction and strength.
- Useful for distinguishing trending vs ranging markets.
- Straightforward to interpret with clear thresholds (70/30 levels).
Limitations:
- May produce false signals in choppy markets.
- Not designed to measure volatility or momentum intensity.
- Should be combined with price action or other indicators for confirmation.
Practicing with the Aroon Indicator
The best way to master the Aroon Indicator is through repeated practice. Instead of waiting days or weeks for signals to play out in live markets, traders can simulate hundreds of chart scenarios using a trading game like ChartingPark. By fast-forwarding historical data, traders can observe how Aroon behaves during trend transitions, consolidations, and breakouts.