52-Week High/Low Indicator Simply Explained
Learn how the 52-week high/low indicator works, what it reveals about market sentiment, and how traders use it in practice.
Introduction
The 52-week high/low indicator tracks the highest and lowest prices an asset has reached over the past year. Traders use it to gauge sentiment, momentum, and potential turning points. It provides a simple yet powerful reference for whether a market is near extreme optimism (52-week high) or pessimism (52-week low).
How the Indicator Works
The indicator measures rolling price extremes within a 52-week (one-year) window:
- 52-week high: The highest traded price over the past year.
- 52-week low: The lowest traded price over the past year.
Each day, the window shifts forward, dropping the oldest day and including the newest. This creates dynamic benchmarks for comparison. Unlike moving averages, it does not smooth data; it simply highlights the extreme levels reached.
How to Read the Indicator
Key signals traders look for:
- Price near 52-week high: Indicates strong bullish sentiment. Some traders view breakouts above this level as continuation signals.
- Price near 52-week low: Suggests bearish pressure. Breakdown below this level may point to further weakness.
- Mid-range positioning: Prices between high and low often suggest consolidation or neutral sentiment.
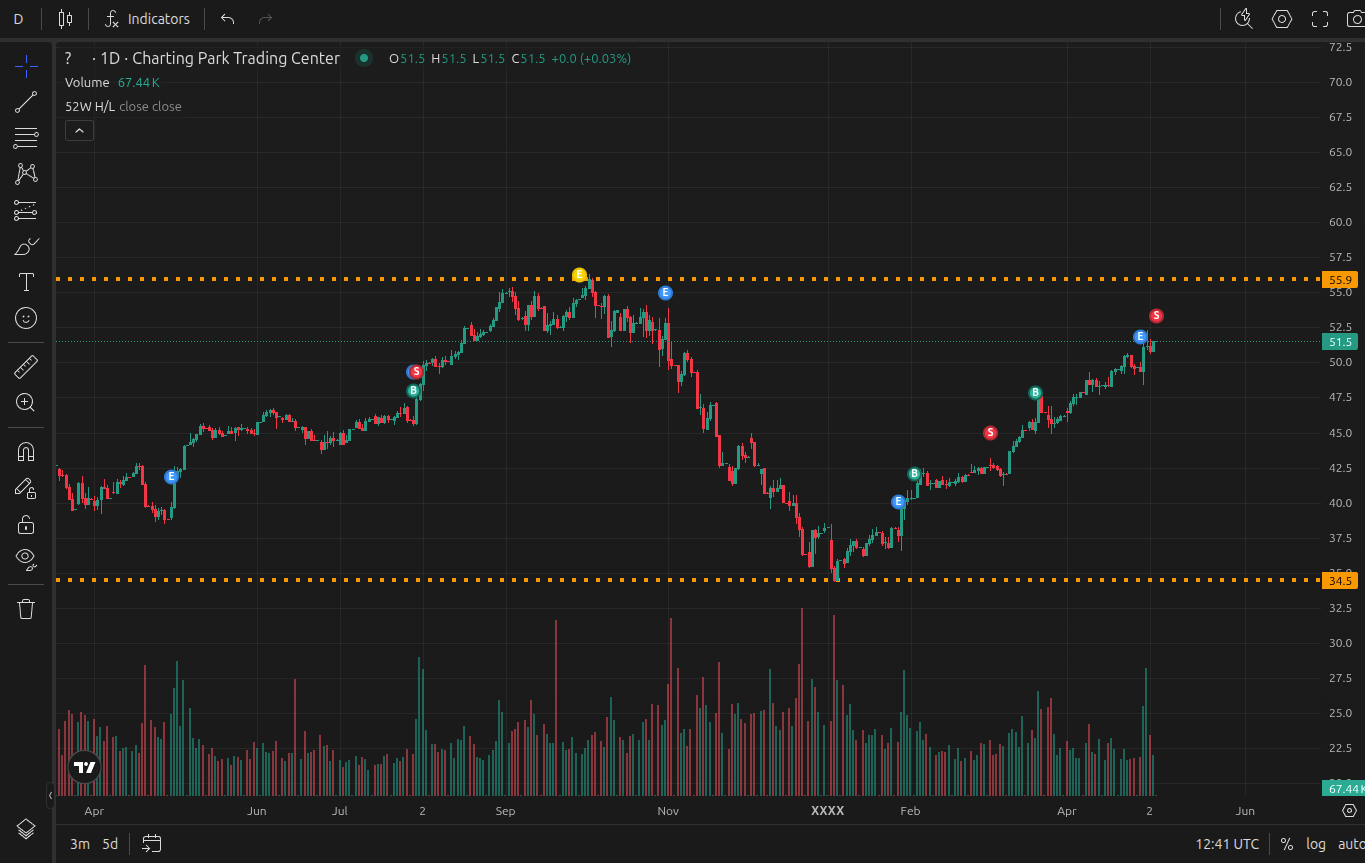
Example of 52-week high/low levels displayed on a TradingView chart
Common Trading Strategies with the 52-Week High/Low
- Breakout trading: Buying when price breaks above the 52-week high, betting on momentum continuation.
- Mean reversion: Shorting near highs or going long near lows if traders expect reversals.
- Relative strength comparison: Screening assets making new 52-week highs as signs of leadership, or avoiding those near lows as weak performers.
Settings can also vary: some traders track 20-day or 90-day highs/lows for shorter-term trading.
Strengths and Limitations
Strengths:
- Simple and widely recognized by market participants.
- Useful for identifying strong momentum or weak laggards.
- Works across asset classes (stocks, crypto, forex).
Limitations:
- Can generate false signals, especially during low-volume breakouts.
- Does not account for volatility or risk/reward ratios.
- Best used with confirmation from other tools such as RSI or moving averages.
Practicing with the Indicator
The best way to build skill with the 52-week high/low is to practice spotting and trading around these levels. Inside a trading simulator like ChartingPark, traders can fast-forward through historical data, test breakout and reversal strategies, and analyze results without risk. Reviewing completed sessions helps connect high/low signals with performance metrics like expectancy and drawdowns.
Conclusion
The 52-week high/low indicator offers a straightforward way to assess market sentiment and spot potential opportunities. While simple, it can be powerful when combined with confirmation tools and sound risk management. Traders looking to refine their timing and execution can benefit from practicing this indicator in a simulated environment.